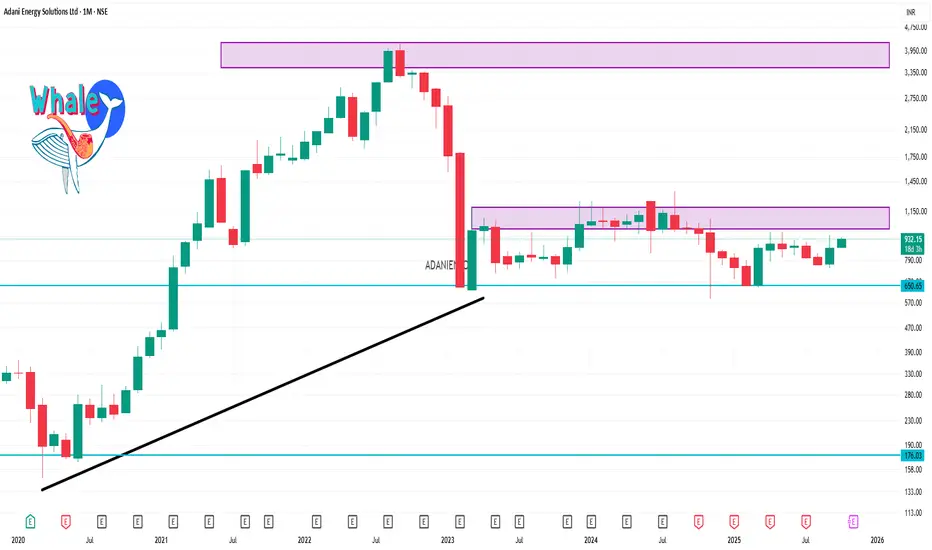
📈 Current Stock Price (NSE)
Price: ₹925.85
Day Range: ₹920.85 – ₹934.00
52-Week Range: ₹588.00 – ₹1,090.95
Market Cap: ₹111,227 crore
P/E Ratio: 41.95
Dividend Yield: 0.00%
🔍 Technical Analysis (1-Month Outlook)
Trend Indicators
1-Month Rating: Buy
1-Week Rating: Buy
Overall Trend: Strong Buy
Key Technical Indicators
RSI (14-day): 52.97 (Neutral)
MACD: 2.12 (Buy Signal)
Moving Averages:
5-Day EMA: ₹920.80
10-Day EMA: ₹909.40
20-Day EMA: ₹886.80
Support & Resistance Levels
Resistance:
First: ₹934.20
Second: ₹942.55
Third: ₹952.15
Support: ₹920.85 (Day Low)
Related publications
Disclaimer
The information and publications are not meant to be, and do not constitute, financial, investment, trading, or other types of advice or recommendations supplied or endorsed by TradingView. Read more in the Terms of Use.
Related publications
Disclaimer
The information and publications are not meant to be, and do not constitute, financial, investment, trading, or other types of advice or recommendations supplied or endorsed by TradingView. Read more in the Terms of Use.