---
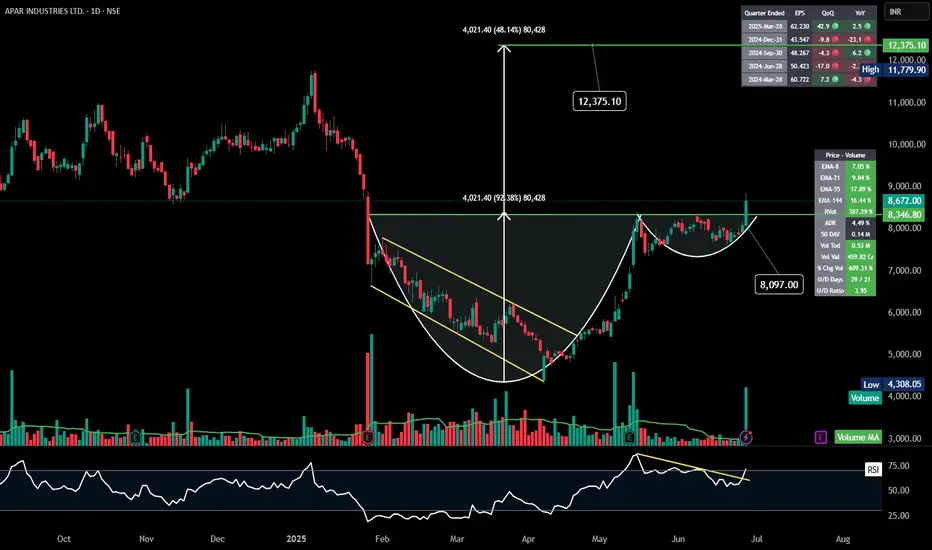
### 📊 **Chart Pattern: Cup and Handle Breakout**
* **Cup Depth**: ₹4,021.40
* **Breakout Point**: ₹8,346.00
* **Target Price**:
₹8,346 + ₹4,021 = **₹12,375** (approx. shown on chart as ₹12,375.10)
* **Handle Formation**: Clean consolidation post-cup; breakout seen today.
* **Breakout Candle**: Strong wide-range bullish candle with high volume (336.87K shares) → confirms breakout strength.
---
### 🔍 **Volume & RSI Analysis**
#### 📈 Volume:
* Spike on breakout day → indicates **institutional participation**.
* Volume is \~350% higher than average, adding conviction to the move.
#### 📊 RSI:
* Prior **bearish divergence** resolved.
* RSI breakout above trendline → **momentum back in favor of bulls**.
---
### 📌 **Key Indicators**
| Indicator | Value / Trend | Implication |
| ----------------- | ------------------- | --------------------------------------------------------------- |
| EMA-8 to EMA-144 | All aligned bullish | Strong trend continuation |
| Pivot (Daily) | ₹8,346.80 | Price currently below Pivot, could act as short-term resistance |
| U/D Ratio | 3.81 | Very bullish (more up days vs. down) |
| Volume %Chg | +350.64% | Breakout confirmation |
| ADR (Daily Range) | 4.49% | Volatility increasing with price |
---
### 🔔 **Key Levels to Watch**
* **Support (Re-test Level)**: ₹8,346 (breakout zone)
* **Resistance/Target**: ₹12,375
* **Invalidation**: Breakdown below ₹8,097 (failed breakout scenario)
---
### 🧭 **Trade Idea (if trading)**
| Entry | ₹8,150–₹8,300 (on retest or continuation) |
| ----------- | ----------------------------------------- |
| Stop Loss | ₹8,097 (below breakout handle base) |
| Target | ₹12,375 |
| Risk–Reward | \~1:4+ (favorable setup) |
---
### 📌 Final Verdict:
This is a **textbook cup and handle breakout** with volume and momentum confirmation. The price structure, RSI breakout, and EMA alignment all support a bullish outlook toward ₹12,375 in the coming weeks.
Disclaimer
The information and publications are not meant to be, and do not constitute, financial, investment, trading, or other types of advice or recommendations supplied or endorsed by TradingView. Read more in the Terms of Use.
Disclaimer
The information and publications are not meant to be, and do not constitute, financial, investment, trading, or other types of advice or recommendations supplied or endorsed by TradingView. Read more in the Terms of Use.