🔎 Overview
------------------------------------------------------------
📊 Key Levels
------------------------------------------------------------
🧭 How to Read Market Behavior Using AAVP
------------------------------------------------------------
📊 Chart Explanation
------------------------------------------------------------
📌 Why AAVP Matters
------------------------------------------------------------
📝 Summary
------------------------------------------------------------
⚠️ Disclaimer
AAVP (Adaptive Anchored Volume Profile) is a market-structure visualization tool that highlights where the highest trading activity has occurred over a selected range. It dynamically maps the Value Area, showing where price is being accepted and where rejection is taking place.
This tool helps traders understand:
• Where the market considers “fair value”
• Where price is being accepted
• Where rejection and imbalance begin
------------------------------------------------------------
📊 Key Levels
• POC (Point of Control)
The price level where the maximum volume is traded.
This acts as the market’s fair value zone and a strong magnet for price.
• VAH (Value Area High)
The upper boundary of the high-volume zone.
Above VAH = market showing acceptance at higher prices.
• VAL (Value Area Low)
The lower boundary of the high-volume zone.
Below VAL = market showing acceptance at lower prices.
------------------------------------------------------------
🧭 How to Read Market Behavior Using AAVP
- Price above VAH → Strength and higher price acceptance
- Price below VAL → Weakness and lower price acceptance
- Price between VAH–VAL → Balanced market / equilibrium
- Rejection from VAH or VAL → Possible rotation back toward POC
- Return inside Value Area after breakout → Failed auction signal
------------------------------------------------------------
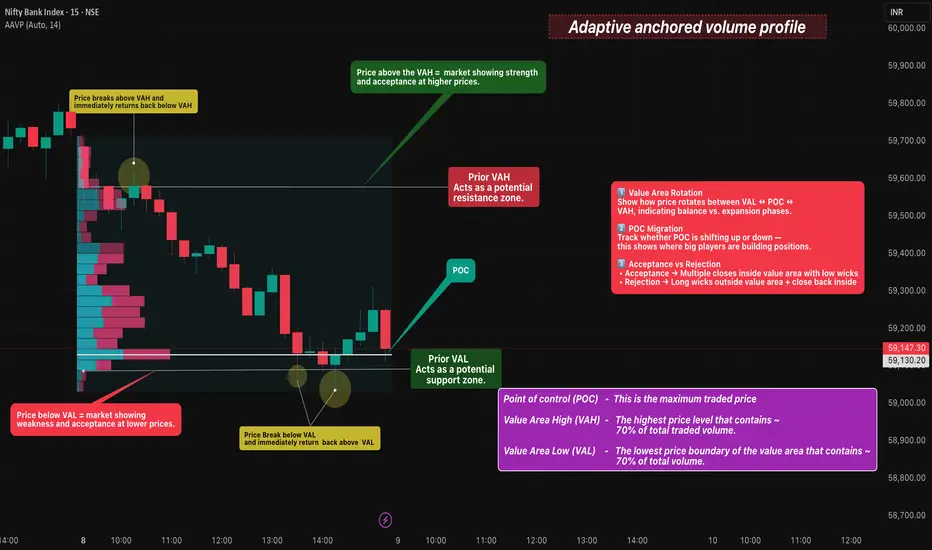
📊 Chart Explanation
• The left side histogram represents the Anchored Volume Profile, showing where the highest participation has occurred.
• The thickest horizontal bar marks the POC (Point of Control), where the market found maximum acceptance.
• The upper boundary of the volume cluster is VAH, acting as a potential resistance and strength confirmation zone.
• The lower boundary of the volume cluster is VAL, acting as a potential support and weakness confirmation zone.
• When price trades above VAH, it indicates acceptance at higher prices.
• When price trades below VAL, it indicates acceptance at lower prices.
• When price rotates between VAH and VAL, the market is in balance and consolidation mode.
• Sharp rejection from VAH or VAL often leads to price rotating back toward the POC.
• If price breaks outside VAH/VAL but quickly returns inside the Value Area, it signals a Failed Auction Setup
------------------------------------------------------------
📌 Why AAVP Matters
- Reveals real participation zones instead of just price levels
- Helps filter fake breakouts using volume acceptance
- Improves precision for intraday and swing context
- Enhances confidence near support, resistance, and equilibrium
------------------------------------------------------------
📝 Summary
AAVP provides a clear visual map of where the market is trading most efficiently.
POC defines fair value, while VAH and VAL define acceptance boundaries.
Price behavior around these zones reveals whether the market is in balance, expansion, or rejection.
------------------------------------------------------------
⚠️ Disclaimer
📘 For educational purposes only.
🙅 Not SEBI registered.
❌ Not a buy/sell recommendation.
🧠 Purely a learning resource.
📊 Not Financial Advice.
Disclaimer
The information and publications are not meant to be, and do not constitute, financial, investment, trading, or other types of advice or recommendations supplied or endorsed by TradingView. Read more in the Terms of Use.
Disclaimer
The information and publications are not meant to be, and do not constitute, financial, investment, trading, or other types of advice or recommendations supplied or endorsed by TradingView. Read more in the Terms of Use.