🔎 Intro / Overview
___________________________________________________________
📔 Concept
___________________________________________________________
📌 How to Use
___________________________________________________________
🎯 Trading Plan
___________________________________________________________
📊 Chart Explanation
___________________________________________________________
👀 Observation
___________________________________________________________
❗ Why It Matters?
___________________________________________________________
🎯 Conclusion
___________________________________________________________
⚠️ Disclaimer
Three-indicator confirmation using Bollinger Bands (BB), MACD, and RSI to align trend and price action.
BB often detects the move first (least lag), MACD follows the BB trend (mid reaction), and RSI confirms last (most lag).
This staged confirmation helps reduce false signals and keeps entries disciplined.
___________________________________________________________
📔 Concept
• Bollinger Bands (BB) → Early detector at volatility extremes.
– Buy: Price first moves outside the [u]lower band[/u], then a candle closes back above lower band → early bullish alert.
– Sell: Price first moves outside the [u]upper band[/u], then a candle closes back below upper band → early bearish alert.
• MACD → Momentum confirmer.
– Buy: MACD [u]crossover above[/u] its signal line supports the bullish shift.
– Sell: MACD [u]crossunder below[/u] its signal line supports the bearish shift.
• RSI → Final confirmation (filters traps).
– Buy: RSI [u]crosses above[/u] its moving average, confirming bullish momentum.
– Sell: RSI [u]crosses below[/u] its moving average, confirming bearish momentum.
✅ Only when BB + MACD + RSI all align in the same direction is the signal confirmed.
Notes:
- BB often reacts first (fastest, but prone to false starts).
- MACD provides mid-reaction confirmation.
- RSI lags but acts as the strongest filter against false trades.
Notes: Sometimes BB reacts immediately; MACD/RSI can prevent traps. At times BB+MACD demand a trade but RSI rejects (good filter); other times RSI demands but BB+MACD filter it.
___________________________________________________________
📌 How to Use
🔴 Sell Signal
1) BB: Price first extends outside upper band in an up-move, then a candle closes back under the upper band → BB sell signal.
2) MACD: Crossunder of MACD line below signal line.
3) RSI: RSI crosses below its moving average → final confirmation.
✅ All three aligned = Valid Sell.
🟢 Buy Signal
1) BB: Price first extends outside lower band in a down-move, then a candle closes back above the lower band → BB buy signal.
2) MACD: Crossover of MACD line above signal line.
3) RSI: RSI crosses above its moving average → final confirmation.
✅ All three aligned = Valid Buy.
___________________________________________________________
🎯 Trading Plan
• Entry → Only when all three confirm in the same direction.
• Stop Loss → - Stop-Loss → Near the structure swing that formed when BB first detected the signal (e.g., recent swing high for shorts / swing low for longs).
• Target → At least 1R; scale/exit remainder using ATR, Fibonacci levels, or box trailing to ride trend.
___________________________________________________________
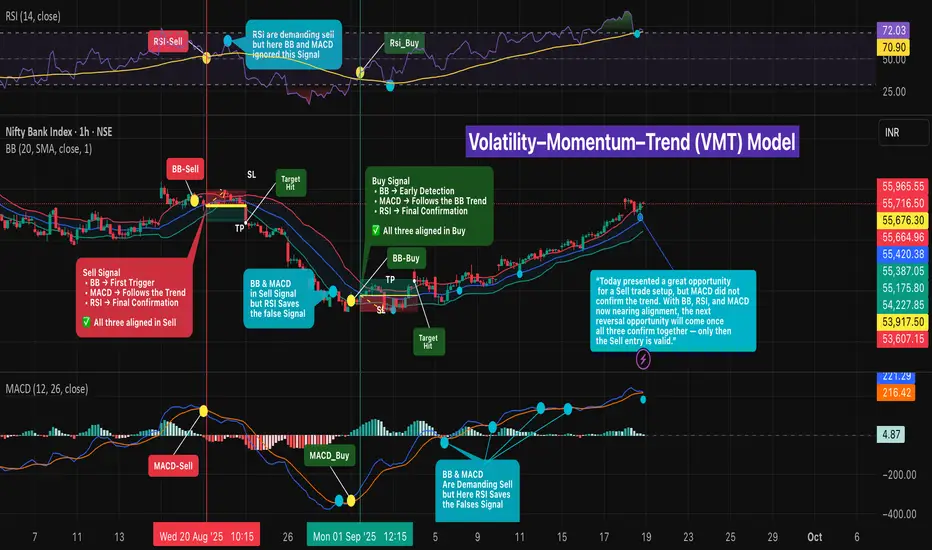
📊 Chart Explanation
Symbol/TF: BANKNIFTY · 1H
1) 20 Aug · 10:15 — SELL
• BB detected first, MACD mid-reaction (after ~2 candles), RSI confirmed last → Entry @ 55,676.30
• Target @ 55,387.05
• Stop-loss @ 55,965.55
• 🎯 Target hit on 22 Aug · 09:15.
• Remaining lots can be trailed using ATR, Fibonacci levels, or Box Trailing to ride the extended trend
2) 29 Aug · 10:15 — FILTERED SELL
• BB and MACD demanded sell, but RSI did not confirm → No trade; RSI saved a false signal.
• 🦋 “The aqua dots represent false signals. At times, BB detects early entries but RSI and MACD do not confirm. Sometimes BB and MACD align, but RSI rejects the move. Other times BB and RSI confirm, yet MACD signals false. ✅ Only when all three align together is the signal valid.”
3) 01 Sep · 13:12 — BUY
• All three aligned long
• Entry @ 53,917.05
• Target @ 54,121.50
• Stop-loss @ 53,712.60
• 🎯 Target hit.
• Remaining lots can be trailed using ATR, Fibonacci levels, or Box Trailing to ride the extended trend
👉🏼“A Sell setup looked promising today, but MACD did not confirm the trend ❌. With BB, RSI, and MACD now nearing alignment, the next reversal opportunity will be valid only when all three confirm together ✅.”
___________________________________________________________
👀 Observation
• BB provides the earliest cue; MACD validates momentum shift; RSI filters late-stage traps.
• Most reliable signals occur near key structure (support/resistance) with confluence.
• Not all alignments are equal—strength improves with decisive closes and supportive volume.
___________________________________________________________
❗ Why It Matters?
•A rule-based, three-step confirmation reduces noise and emotions.
•It clarifies when to enter, when to skip, and how to manage risk consistently across changing market conditions.
___________________________________________________________
🎯 Conclusion
BB → detect, MACD → follow, RSI → confirm.
When all three align, entries are clearer and risk is defined.
🔥 Patterns don’t predict. Rules protect. 🚀
___________________________________________________________
⚠️ Disclaimer
📘 For educational purposes only.
🙅 Not SEBI registered.
❌ Not a buy/sell recommendation.
🧠 Purely a learning resource.
📊 Not Financial Advice.
Note
Yesterday, we identified a possible Sell Entry at 14:15, but the market closed at 15:15 before confirmation.Today, the signal was confirmed:
• Market opened at 09:15.
• By the 10:15 candle close, all three indicators aligned, validating the Sell Signal.
📍 Entry: 55,816.00
🎯 Target: 55,196.75
🛑 Stop Loss: 55,835.25
Disclaimer
The information and publications are not meant to be, and do not constitute, financial, investment, trading, or other types of advice or recommendations supplied or endorsed by TradingView. Read more in the Terms of Use.
Disclaimer
The information and publications are not meant to be, and do not constitute, financial, investment, trading, or other types of advice or recommendations supplied or endorsed by TradingView. Read more in the Terms of Use.