---- Short-term Analysis for the next coming days - Hourly Chart (LOG)-------
BTC/USDT: Upside confirmation level @ 24400 reached - what next?
Context
- The BTC reversed up above yearly key support at 18880 (excess 17900) before drawing a start of bullish reversal in parallel of ETH and Nasdaq and SP500
- The short-term upside potential at 24400 has been reached, now what to focus on to follow the actuel bullish momentum (see below)
previous analysis 11/07/2022 : https://www.tradingview.com/chart/BTCUSD/0khu1JVr-BTC-USDT-Bullish-set-up-above-18800-19800-update/
Market configuration
- Graphical Elements :
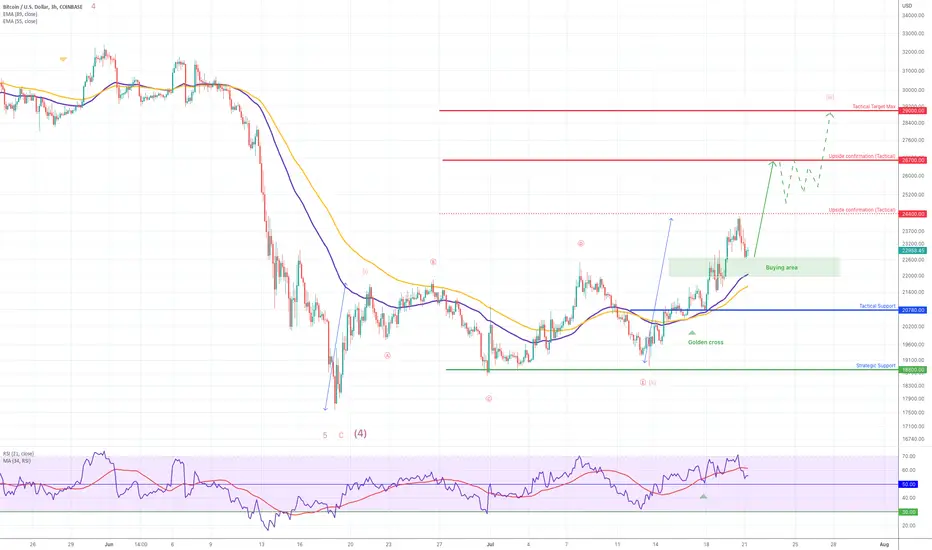
Graphical Resistance = 24400 & 26700
Graphical Support = 18800 & 20780
- Mathematical Indicators:
EMA ( Exp Moving averages) are support with a ''golden cross'' = Bullish
RSI indicator (below) is progressing within positive area above 50% = Bullish to Neutral
- Elliot & Harmonic Wave (Fibonacci):
Fibonacci Target (4) has been already reached = 18800
Fibonacci support of the wave in progress (III) = 20780
Fibonacci Bullish Target = 26700
Fibonacci Bearish Target = 18800
Conclusion
Preferred case => As long as 20780 remains support, we are focus on a bullish breakout of 24400 in order to give the final confirmation for a bullish reversal and open 26700 max 29000 area
Alternative case => Breaking 20780 new bearish attack towards 18800 will occur (double bottom)
BTC/USDT: Upside confirmation level @ 24400 reached - what next?
Context
- The BTC reversed up above yearly key support at 18880 (excess 17900) before drawing a start of bullish reversal in parallel of ETH and Nasdaq and SP500
- The short-term upside potential at 24400 has been reached, now what to focus on to follow the actuel bullish momentum (see below)
previous analysis 11/07/2022 : https://www.tradingview.com/chart/BTCUSD/0khu1JVr-BTC-USDT-Bullish-set-up-above-18800-19800-update/
Market configuration
- Graphical Elements :
Graphical Resistance = 24400 & 26700
Graphical Support = 18800 & 20780
- Mathematical Indicators:
EMA ( Exp Moving averages) are support with a ''golden cross'' = Bullish
RSI indicator (below) is progressing within positive area above 50% = Bullish to Neutral
- Elliot & Harmonic Wave (Fibonacci):
Fibonacci Target (4) has been already reached = 18800
Fibonacci support of the wave in progress (III) = 20780
Fibonacci Bullish Target = 26700
Fibonacci Bearish Target = 18800
Conclusion
Preferred case => As long as 20780 remains support, we are focus on a bullish breakout of 24400 in order to give the final confirmation for a bullish reversal and open 26700 max 29000 area
Alternative case => Breaking 20780 new bearish attack towards 18800 will occur (double bottom)
Trade active
a larger rise is expected after FED decisionCIO & Head of market research (Automata - Vancelian)
vancelian.com/en
vancelian.com/en
Disclaimer
The information and publications are not meant to be, and do not constitute, financial, investment, trading, or other types of advice or recommendations supplied or endorsed by TradingView. Read more in the Terms of Use.
CIO & Head of market research (Automata - Vancelian)
vancelian.com/en
vancelian.com/en
Disclaimer
The information and publications are not meant to be, and do not constitute, financial, investment, trading, or other types of advice or recommendations supplied or endorsed by TradingView. Read more in the Terms of Use.