📊 Chart Overview:
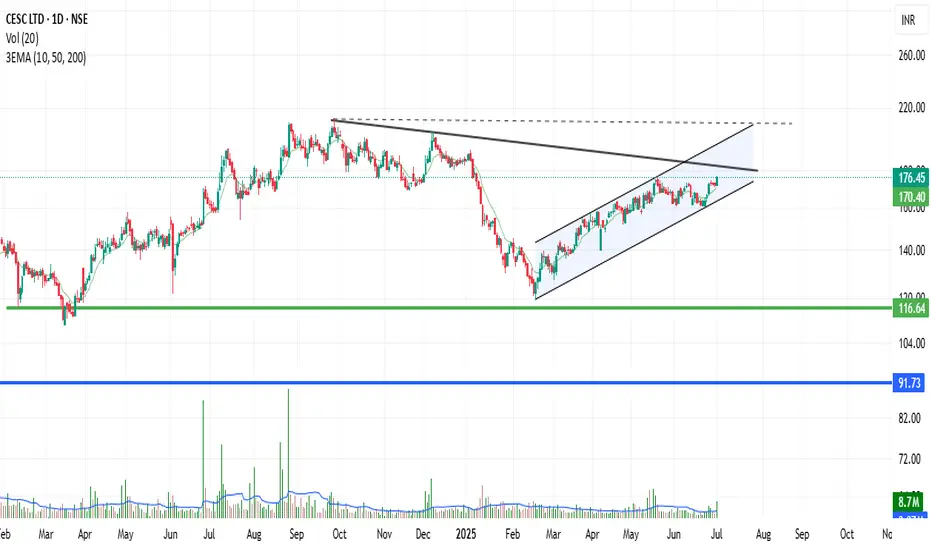
Current Price: ₹176.45 (↑ +2.74%)
Price all 3EMA (10, 50, 200) above → Currently around ₹170.40
Volume: Significant recent spike at 8.7M, above 20-day average volume (3.37M)
Trend Pattern: Ascending channel (marked), approaching major resistance zone
Trend & Structure:
Uptrend within a rising channel since March 2025.
The price is near the upper boundary of the rising channel — short-term resistance zone.
There's a falling trend-line resistance from past highs (Sept–Dec 2024), which the price is currently testing.
Support Zones:
Immediate Support: ₹170 (EMA support & lower channel trend line)
Medium-Term Support: ₹116.64 (horizontal green support line)
Strong Long-Term Support: ₹91.73 and ₹72 (horizontal levels)
Resistance Levels:
Immediate Resistance: ₹178–₹180 (upper channel + descending trendline)
Major Resistance Zone: ₹210–₹220 (previous swing highs)
Volume Analysis:
Volume surge on the breakout attempt indicates buyer interest.
Follow-up confirmation candle needed to validate breakout.
✅ Summary & View:
The stock is in a healthy uptrend and attempting to break above a key resistance confluence (channel top + falling trendline).
Sustained move above ₹180 with volume can trigger a bullish breakout toward ₹200–₹220.
Traders should watch for breakout confirmation or possible rejection near the current level.
Ideal entry on pullback near ₹170 with SL below channel for swing traders.
Disclaimer
The information and publications are not meant to be, and do not constitute, financial, investment, trading, or other types of advice or recommendations supplied or endorsed by TradingView. Read more in the Terms of Use.
Disclaimer
The information and publications are not meant to be, and do not constitute, financial, investment, trading, or other types of advice or recommendations supplied or endorsed by TradingView. Read more in the Terms of Use.