🚀 Breakout Watch Alert: Nifty SmallCap 100 Index (CNXSMALLCAP)
📌 Price: ₹17,147 📅 Date: 14-05-2025
① Pattern Name, Timeframe, Structure & Explanation
Pattern: Inverted Head & Shoulders
Timeframe: Daily Chart
Duration: \~4 Months (From Jan to May 2025)
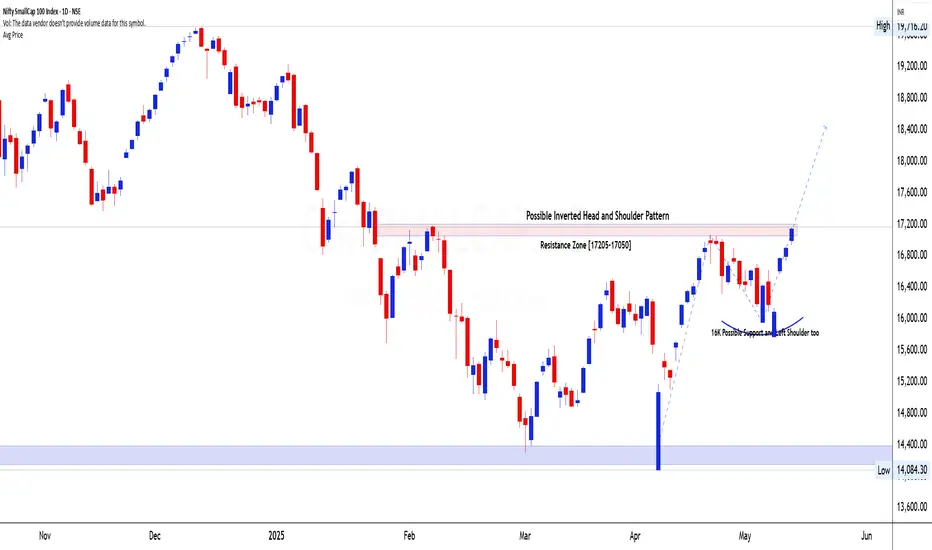
The Nifty SmallCap 100 Index has formed a well-defined Inverted Head and Shoulders pattern, a bullish reversal structure commonly seen at the end of a downtrend. This pattern spans across four months with:
* Left Shoulder: Formed in early March after a sharp drop from 17,200
* Head: Deep retest toward the 16,000 zone in mid-April
* Right Shoulder: Shallow retest of the same 16,000 support in early May, confirming accumulation
The neckline of this pattern lies in the 17,050–17,200 resistance zone, which has already been tested twice before and now again in mid-May, creating a powerful breakout scenario.
② Volume Formation (During Pattern, Breakout, and Retest)
While exact volume data isn't available on this index chart, we can infer participation from the candlestick structure:
* During the pattern: The volume was likely lower during the head formation and began picking up as price formed the right shoulder.
* Last 4 Days: Strong bullish marubozu candles suggest heavy demand stepping in — indicative of institutional activity and rotation into smallcaps.
* Retest Volume: If a minor pullback occurs toward the neckline post-breakout, watch for lower volume to confirm a constructive retest.
③ Breakout Candlestick, Follow-Through & Trap Behavior
* Breakout Zone: ₹17,205–17,250
* The past four sessions include strong bullish marubozu candles — full-bodied with little to no upper wicks, implying decisive momentum.
* The clean structure avoids false moves — a tight V-shape bottom at the head followed by a right shoulder that mirrors the left. There's no bear trap, but a clear build-up without volatility spikes — ideal for positional traders.
④ Trade Explanation (Entry, Target, Stop-loss, Risk\:Reward)
* Entry Zone: ₹17,250+ (Breakout confirmation above neckline)
* Stop-loss: ₹16,500 (below right shoulder support & recent swing lows)
* Target Zone: ₹18,000 (1st target), ₹19,500 (extended target)
📏 *Measured Move Logic:*
Neckline = ₹17,200
Head = ₹16,000
Breakout Move ≈ ₹1,200
Projected target = ₹17,200 + ₹1,200 = ₹18,400 (Aligns with our zone)
Risk\:Reward:
Risk = ₹750
Reward = ₹1,250 to ₹2,000
R\:R = \~1:1.7 to 1:2.5
📌 Price: ₹17,147 📅 Date: 14-05-2025
① Pattern Name, Timeframe, Structure & Explanation
Pattern: Inverted Head & Shoulders
Timeframe: Daily Chart
Duration: \~4 Months (From Jan to May 2025)
The Nifty SmallCap 100 Index has formed a well-defined Inverted Head and Shoulders pattern, a bullish reversal structure commonly seen at the end of a downtrend. This pattern spans across four months with:
* Left Shoulder: Formed in early March after a sharp drop from 17,200
* Head: Deep retest toward the 16,000 zone in mid-April
* Right Shoulder: Shallow retest of the same 16,000 support in early May, confirming accumulation
The neckline of this pattern lies in the 17,050–17,200 resistance zone, which has already been tested twice before and now again in mid-May, creating a powerful breakout scenario.
② Volume Formation (During Pattern, Breakout, and Retest)
While exact volume data isn't available on this index chart, we can infer participation from the candlestick structure:
* During the pattern: The volume was likely lower during the head formation and began picking up as price formed the right shoulder.
* Last 4 Days: Strong bullish marubozu candles suggest heavy demand stepping in — indicative of institutional activity and rotation into smallcaps.
* Retest Volume: If a minor pullback occurs toward the neckline post-breakout, watch for lower volume to confirm a constructive retest.
③ Breakout Candlestick, Follow-Through & Trap Behavior
* Breakout Zone: ₹17,205–17,250
* The past four sessions include strong bullish marubozu candles — full-bodied with little to no upper wicks, implying decisive momentum.
* The clean structure avoids false moves — a tight V-shape bottom at the head followed by a right shoulder that mirrors the left. There's no bear trap, but a clear build-up without volatility spikes — ideal for positional traders.
④ Trade Explanation (Entry, Target, Stop-loss, Risk\:Reward)
* Entry Zone: ₹17,250+ (Breakout confirmation above neckline)
* Stop-loss: ₹16,500 (below right shoulder support & recent swing lows)
* Target Zone: ₹18,000 (1st target), ₹19,500 (extended target)
📏 *Measured Move Logic:*
Neckline = ₹17,200
Head = ₹16,000
Breakout Move ≈ ₹1,200
Projected target = ₹17,200 + ₹1,200 = ₹18,400 (Aligns with our zone)
Risk\:Reward:
Risk = ₹750
Reward = ₹1,250 to ₹2,000
R\:R = \~1:1.7 to 1:2.5
Learn Today for Better Tomorrow
Disclaimer
The information and publications are not meant to be, and do not constitute, financial, investment, trading, or other types of advice or recommendations supplied or endorsed by TradingView. Read more in the Terms of Use.
Learn Today for Better Tomorrow
Disclaimer
The information and publications are not meant to be, and do not constitute, financial, investment, trading, or other types of advice or recommendations supplied or endorsed by TradingView. Read more in the Terms of Use.