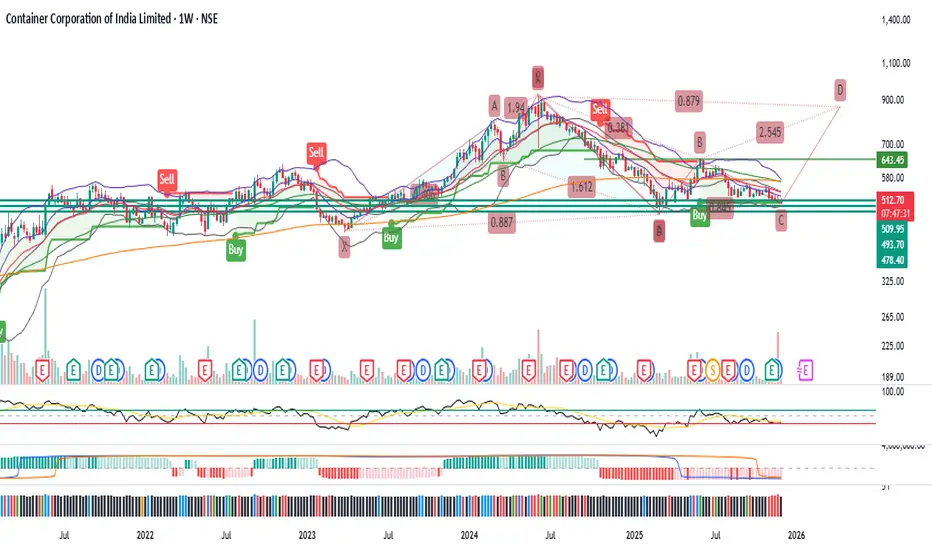
Concor appears to be an interesting chart with following
1. A Bullish harmonic pattern completed and new harmonic under construction
2. Double bottom like structure on weekly chart
3. RSI taking support on 40 levels on both weekly and monthly charts
4. Morning star like pattern on daily chart
5. Seems to be a low risk reversal candidate with major supports near 490 and 470 levels
Lets See How it Evolves.
Disclaimer: NOT A BUY / SELL RECOMMENDATION I am not an expert I just share interesting charts here for educational purpose and not to be taken as buy/sell recommendation. Please seek expert opinion before investing and trading as trading/ investing in market is subject to market risks. I do not hold any position in the stock as on date but I may look to take some position with my own Risk Reward matrix.
Disclaimer
The information and publications are not meant to be, and do not constitute, financial, investment, trading, or other types of advice or recommendations supplied or endorsed by TradingView. Read more in the Terms of Use.
Disclaimer
The information and publications are not meant to be, and do not constitute, financial, investment, trading, or other types of advice or recommendations supplied or endorsed by TradingView. Read more in the Terms of Use.