Parameters Data
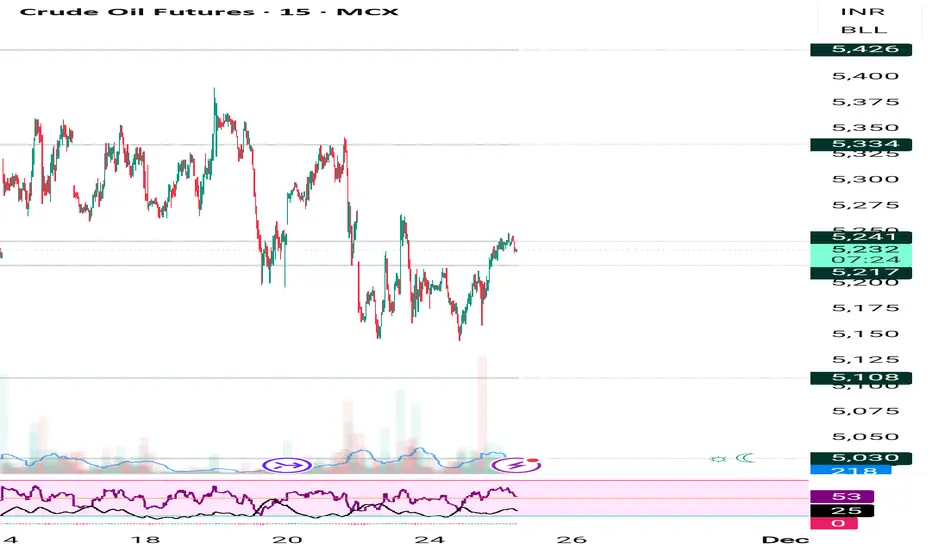
Asset Name Crude Oil MCX [ ₹5,230.00 ⬇️ (-0.10%) ]
Reason 🟨 Global oil market mein surplus supply ki umeed aur Russia-Ukraine peace deal ki speculations ke chalte minor pressure.
R:R 🟨 N/A (Range-bound) / Threshold: Breakout above -[ 5250.00 ] & Breakdown below [ -5200.00 ]
Current Trade 🟨 AVOID | R1: 5250.00, R2: 5280.00, R3: 5320.00 | S1: 5200.00, S2: 5170.00, S3: 5140.00
Probability 🟨 50%
Confidence 🟨 15/30 [50%] (Technical support hai, par global news flow bearish hai, isliye Neutral Confidence.)
Price Movement Buy side: 5250.00, 5280.00, 5320.00. If break 5200.00 then downside possible towards 5170.00, 5140.00, 5100.00.
FNO Data (OI/PCR) 🟨 PCR 0.88-0.95 ki range mein hai (Neutral to mild Bearish). Mixed OI activity.
Liquidity Zones 🟨 Liquidity ₹5,200 - ₹5,250 ke beech tight hai, jo consolidation dikhata hai.
Max Pain 🟨 5200-5250 (Is zone ke aas paas hi range dikhata hai.)
Gamma Exposure 🟨 Gamma flat hai.
Supports 🟨 S1: 5200.00 (Major Psychological/DEMA) | S2: 5170.00 | S3: 5140.00
Resistances 🟨 R1: 5250.00 (Immediate Resistance) | R2: 5280.00 | R3: 5320.00
DEMA Levels 🟩 Price majority SMAs/EMAs (5, 10, 20 DEMA) se upar hai, but near-term EMA 200 (approx. 5211) ke aas paas hai.
ADX/RSI/DMI 🟨 RSI (14) 53.85 (Neutral). Trend weak ho raha hai.
Market Depth 🟨 Buying aur Selling orders almost equal hain.
Cross‑Asset Correlation 🟥 Brent aur WTI futures dono hi down chal rahe hain.
COT Positioning 🟨 Hedge funds net long hain, par sentiment cautious hai.
Source Ledger 🟨 MCX, Investing.com, TradingView, CME.
Disclaimer
The information and publications are not meant to be, and do not constitute, financial, investment, trading, or other types of advice or recommendations supplied or endorsed by TradingView. Read more in the Terms of Use.
Disclaimer
The information and publications are not meant to be, and do not constitute, financial, investment, trading, or other types of advice or recommendations supplied or endorsed by TradingView. Read more in the Terms of Use.