Devyani Intl – Triangle Breakout Loading? 🚀
📊 Stock Analysis: Devyani International Ltd (NSE: DEYANI)
🔹 Technical Overview
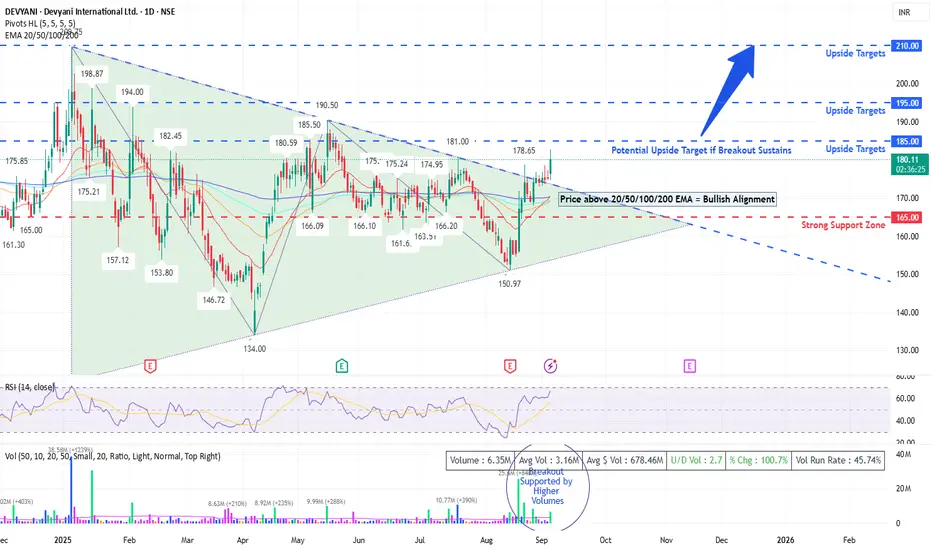
Pattern: Symmetrical Triangle breakout attempt visible on daily charts. Price has tested the upper resistance trendline multiple times (₹190–₹195 zone) and is now trading above short-term EMAs.
Key Support Levels: ₹165, ₹150
Immediate Resistance Levels: ₹185, ₹195 (major breakout zone)
Indicators:
RSI (14): 66.5 → Positive momentum, but near overbought levels.
EMA Cluster (20/50/100/200): Price trading above all key EMAs – strong short-term bullish signal.
Volume: Breakout supported with above-average volumes (5.3M vs 3.1M avg).
➡️ A sustained close above ₹185–₹190 could trigger a rally towards ₹200–₹210.
🔹 Fundamental Snapshot
Business Model: Devyani International Ltd is the largest franchisee of Yum! Brands in India, operating KFC, Pizza Hut, and Costa Coffee.
Growth Drivers:
Rapid store expansions (targeting Tier II/III cities).
Rising QSR demand in India with improving urban disposable income.
Long-term industry tailwinds in organized food retail.
Risks:
Margin pressures due to inflation in raw materials.
Intense competition in QSR space (Domino’s, McDonald’s, Burger King).
High dependence on discretionary consumer spending.
🔹 Trading Strategy
Short-Term (1–3 weeks): Buy on dips near ₹170–₹175, SL below ₹165. Target: ₹190 / ₹200.
Medium-Term (2–3 months): If breakout above ₹195 holds with volume, positional target can be ₹220+.
Risk Management: Keep SL below triangle support (₹160) for positional trades.
🔹 Sentiment & Outlook
📈 With improving consumer demand and strong expansion plans, Devyani remains a long-term growth story in India’s QSR sector. Current technical setup indicates a potential breakout rally if momentum sustains above ₹185–₹190.
⚡ Conclusion:
👉 Stock is at a make-or-break zone. Sustained move above ₹190 could unlock fresh highs, while failure may keep it in consolidation within the triangle.
📊 Stock Analysis: Devyani International Ltd (NSE: DEYANI)
🔹 Technical Overview
Pattern: Symmetrical Triangle breakout attempt visible on daily charts. Price has tested the upper resistance trendline multiple times (₹190–₹195 zone) and is now trading above short-term EMAs.
Key Support Levels: ₹165, ₹150
Immediate Resistance Levels: ₹185, ₹195 (major breakout zone)
Indicators:
RSI (14): 66.5 → Positive momentum, but near overbought levels.
EMA Cluster (20/50/100/200): Price trading above all key EMAs – strong short-term bullish signal.
Volume: Breakout supported with above-average volumes (5.3M vs 3.1M avg).
➡️ A sustained close above ₹185–₹190 could trigger a rally towards ₹200–₹210.
🔹 Fundamental Snapshot
Business Model: Devyani International Ltd is the largest franchisee of Yum! Brands in India, operating KFC, Pizza Hut, and Costa Coffee.
Growth Drivers:
Rapid store expansions (targeting Tier II/III cities).
Rising QSR demand in India with improving urban disposable income.
Long-term industry tailwinds in organized food retail.
Risks:
Margin pressures due to inflation in raw materials.
Intense competition in QSR space (Domino’s, McDonald’s, Burger King).
High dependence on discretionary consumer spending.
🔹 Trading Strategy
Short-Term (1–3 weeks): Buy on dips near ₹170–₹175, SL below ₹165. Target: ₹190 / ₹200.
Medium-Term (2–3 months): If breakout above ₹195 holds with volume, positional target can be ₹220+.
Risk Management: Keep SL below triangle support (₹160) for positional trades.
🔹 Sentiment & Outlook
📈 With improving consumer demand and strong expansion plans, Devyani remains a long-term growth story in India’s QSR sector. Current technical setup indicates a potential breakout rally if momentum sustains above ₹185–₹190.
⚡ Conclusion:
👉 Stock is at a make-or-break zone. Sustained move above ₹190 could unlock fresh highs, while failure may keep it in consolidation within the triangle.
Disclaimer
The information and publications are not meant to be, and do not constitute, financial, investment, trading, or other types of advice or recommendations supplied or endorsed by TradingView. Read more in the Terms of Use.
Disclaimer
The information and publications are not meant to be, and do not constitute, financial, investment, trading, or other types of advice or recommendations supplied or endorsed by TradingView. Read more in the Terms of Use.