two pictures seen in this stock -
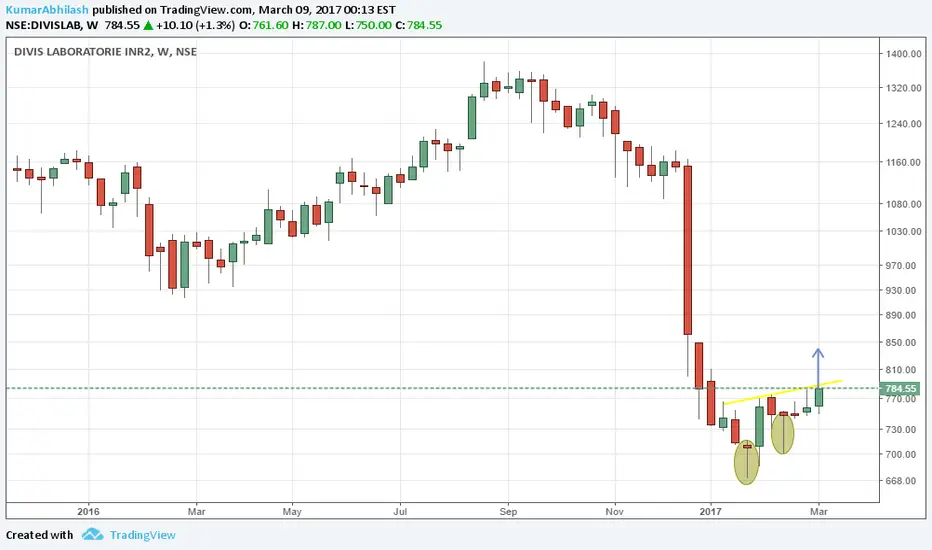
1 . on weekly charts from 2 weeks we r seeing 2 hammer candles, which itself shows a strong demand zone between 660 720 zone .
2 . on daily chart we can see a small traingle setup .

for day traders buy with 780 sl for 830 target
for medium term trader buy for 900 level sl 765
1 . on weekly charts from 2 weeks we r seeing 2 hammer candles, which itself shows a strong demand zone between 660 720 zone .
2 . on daily chart we can see a small traingle setup .
for day traders buy with 780 sl for 830 target
for medium term trader buy for 900 level sl 765
Trade closed manually
Note
seems a bull trap(personal view), ignore tradeNote
or trade with very tight slNote
bull got trapped
784 to 754
Note
once again bull got trapped.
its clearly visible on weekly chart that its in extremly bearish trend and flag pattern was in formation which again is a continuation pattern which suggest a downward breakdown which it gave today.
bull trap. it should touch 600 level before any bounce.
KA
Disclaimer
The information and publications are not meant to be, and do not constitute, financial, investment, trading, or other types of advice or recommendations supplied or endorsed by TradingView. Read more in the Terms of Use.
KA
Disclaimer
The information and publications are not meant to be, and do not constitute, financial, investment, trading, or other types of advice or recommendations supplied or endorsed by TradingView. Read more in the Terms of Use.