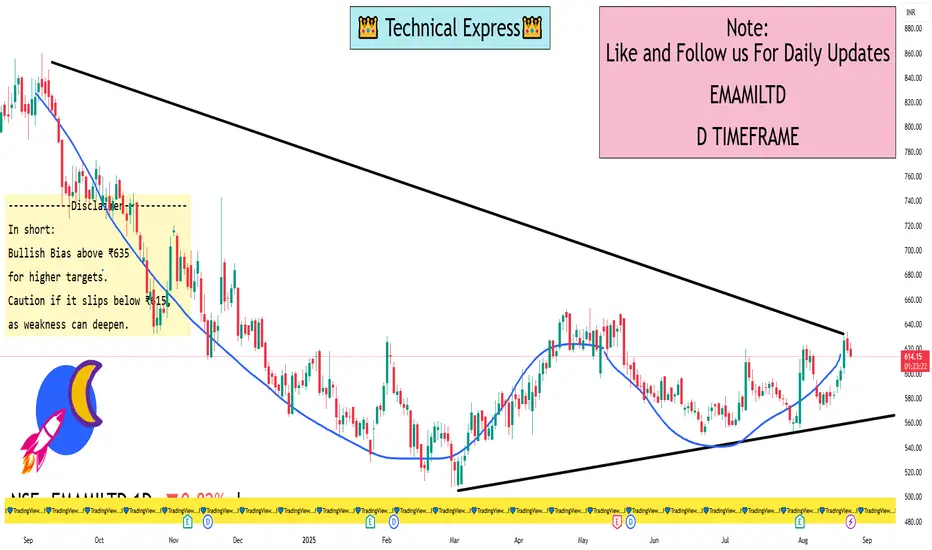
Emami Ltd – Daily Levels
Current Market Structure: Stock is trading in a consolidation range after a recent upward move. Momentum is steady but showing mild profit-booking near resistance.
🔑 Key Levels
Support Zones
₹615 – Strong near-term support, recent demand zone.
₹600 – Major support, breakdown below may invite weakness.
₹585 – Next cushion if selling extends.
Resistance Zones
₹635 – Immediate resistance (recent supply zone).
₹648 – Breakout level; above this stock may gain momentum.
₹660+ – Next bullish target if breakout sustains.
Trend Outlook
Above ₹635 → Momentum buyers may push toward ₹648–660.
Below ₹615 → Weakness may drag it back toward ₹600–585.
📌 Indicators View
Volume: Decreasing, showing consolidation.
RSI (Daily): Near neutral zone (~50–55), showing balanced momentum.
200 DMA: Stock trading comfortably above it, indicating long-term bullishness intact.
I built a Buy & Sell Signal Indicator with 85% accuracy.
📈 Get access via DM or
WhatsApp: wa.link/d997q0
Contact - +91 76782 40962
| Email: techncialexpress@gmail.com
| Script Coder | Trader | Investor | From India
📈 Get access via DM or
WhatsApp: wa.link/d997q0
Contact - +91 76782 40962
| Email: techncialexpress@gmail.com
| Script Coder | Trader | Investor | From India
Related publications
Disclaimer
The information and publications are not meant to be, and do not constitute, financial, investment, trading, or other types of advice or recommendations supplied or endorsed by TradingView. Read more in the Terms of Use.