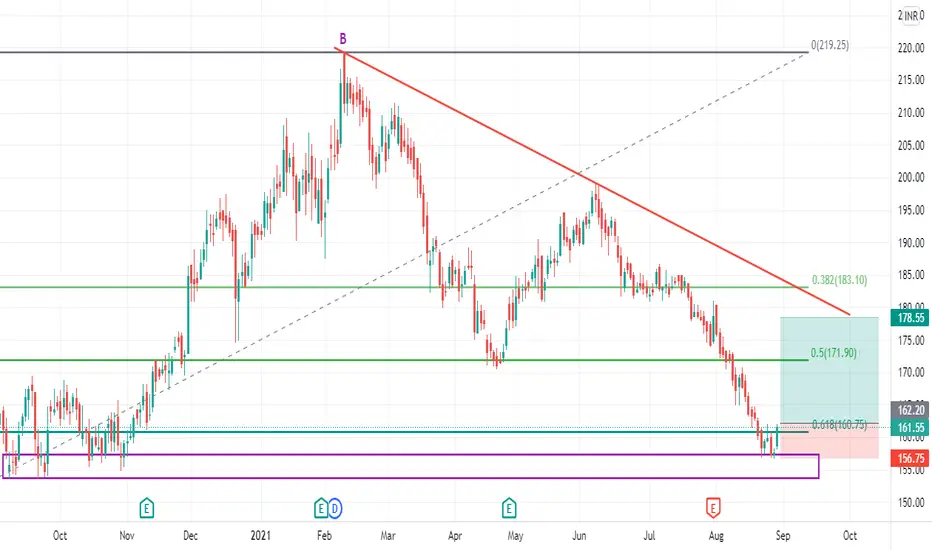
Go Long above 162.2 for Targets of 167.65, 173.1, and 178.55 with SL 156.75
Reasons to go Long :
1. On a daily timeframe if we draw the Fibonacci retracement tool from recent swing low (point A) to recent swing high (point B) then we see stock took support from 0.618 Fibonacci level.
2. A bullish chart pattern, Double Bottom (W pattern) is formed around 0.618 Fibonacci level.
3. Also there is a strong demand zone (marked with purple color), from which the stock initially faced resistance but now is taking support and moving up.
4. The stock may go up to the trendline where it may face resistance.
Trade active
Entry triggered on 31 Aug 2021Trade closed: target reached
Target 1 achieved on 01 Sep 2021Trade closed: target reached
Target 2 & Target 3 achieved on 02 Sep 2021Disclaimer
The information and publications are not meant to be, and do not constitute, financial, investment, trading, or other types of advice or recommendations supplied or endorsed by TradingView. Read more in the Terms of Use.
Disclaimer
The information and publications are not meant to be, and do not constitute, financial, investment, trading, or other types of advice or recommendations supplied or endorsed by TradingView. Read more in the Terms of Use.