GALA/USDT (4H Analysis)
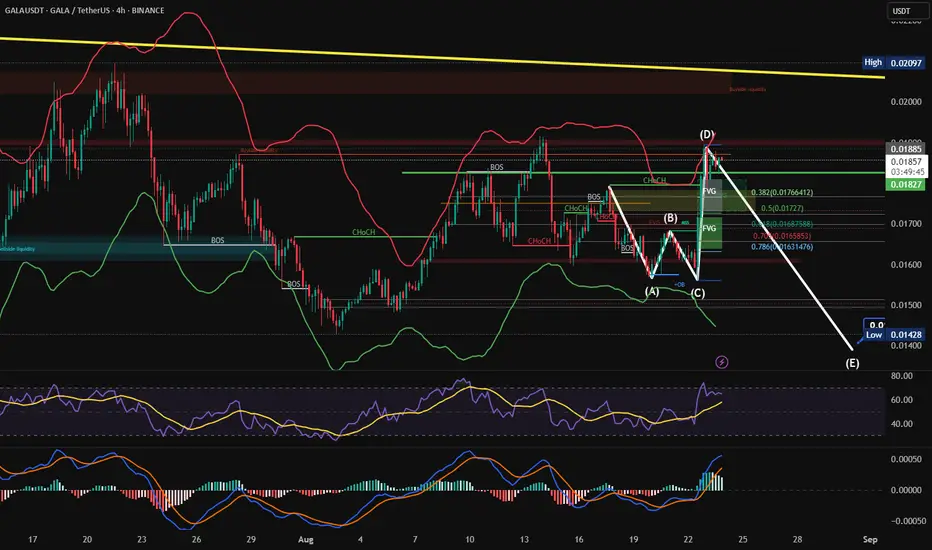
The chart illustrates a detailed Elliott Wave structure forming within the 4H timeframe. Price action recently completed a corrective move (A → B → C) and extended into point (D) before showing potential signs of reversal.
Resistance Zones:
Price is testing strong supply around 0.0188 – 0.0192, aligned with Fibonacci retracement levels and previous liquidity zones.
Support & Downside Targets:
If rejection holds, the market may follow the projected (D → E) leg down toward 0.0145 – 0.0140, completing the corrective cycle.
Indicators:
RSI is approaching overbought conditions, hinting at possible bearish divergence.
MACD shows strong momentum, but a cross-down could confirm reversal.
Bollinger Bands suggest price touched the upper band and may revert inward.
Key Levels to Watch:
Resistance: 0.01885 / 0.02000
Mid Support: 0.0172 – 0.0165 (Fib 0.5–0.786)
Strong Support: 0.0145 – 0.0140
⚠️ Outlook: The short-term bias remains corrective bearish unless price breaks and consolidates above 0.0200, which could invalidate the (E) target and open the way for a bullish continuation.
Disclaimer
The information and publications are not meant to be, and do not constitute, financial, investment, trading, or other types of advice or recommendations supplied or endorsed by TradingView. Read more in the Terms of Use.
Disclaimer
The information and publications are not meant to be, and do not constitute, financial, investment, trading, or other types of advice or recommendations supplied or endorsed by TradingView. Read more in the Terms of Use.