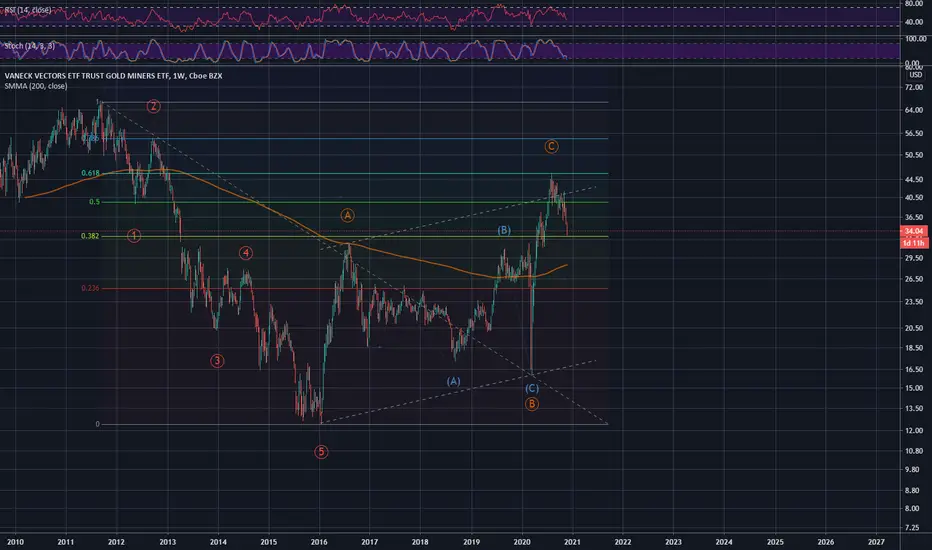
On the chart we see nice 5 wave move down from 2011 till 2016 followed by 61% running flat correction topped in Aug this year. This probably can give us some clue on whether the following Gold price fall is a short term correction or a beginning of a long term down trend. I would bet the latter.
Related publications
Disclaimer
The information and publications are not meant to be, and do not constitute, financial, investment, trading, or other types of advice or recommendations supplied or endorsed by TradingView. Read more in the Terms of Use.
Related publications
Disclaimer
The information and publications are not meant to be, and do not constitute, financial, investment, trading, or other types of advice or recommendations supplied or endorsed by TradingView. Read more in the Terms of Use.