Gold Technical Analysis:
Daily Resistance: 4150, Support: 4000
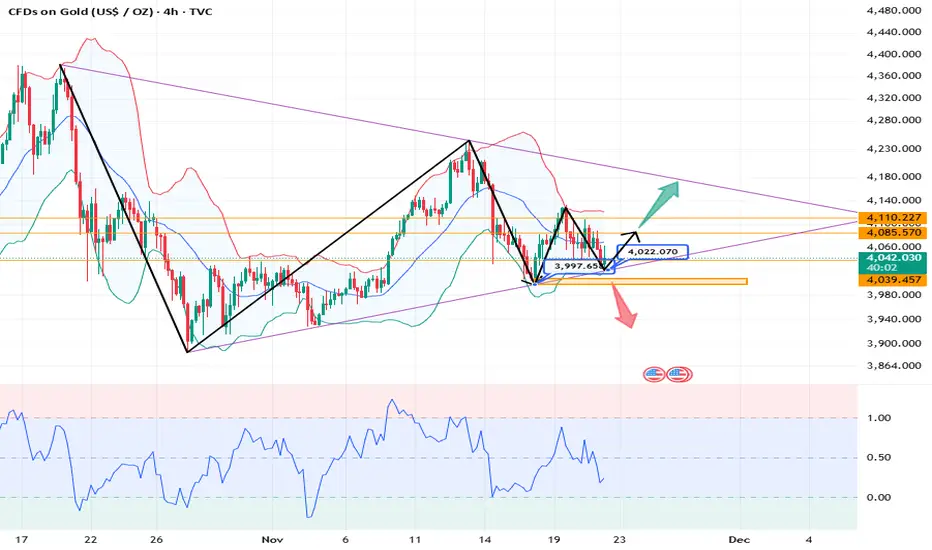
4-Hour Resistance: 4110, Support: 4010
1-Hour Resistance: 4085, Support: 4020
Technically, the weekly chart is likely to close with a doji today. Yesterday's daily chart closed with a doji, indicating a slowdown in the short-term upward trend and exacerbating the expectation of sideways consolidation. The Bollinger Bands are also narrowing, and the effectiveness of the 4040 support level needs to be monitored today. Meanwhile, the 4000 level is being tested again. If 4020 is broken, a short-term sell signal can be adopted. If the price can hold above 4085, a buy signal can be adopted, with the 4140/4150 area to be watched again. Long-term holders can still look for buying opportunities around the 3930/3920 level;
Looking at the 1-hour chart, gold rebounded after the European session, but after breaking below 4080, there's a possibility of further downside in the short term. Watch for support around 4020;
For the European and American sessions, the plan is to consider buying if a stabilization signal appears around 4005/4000.
Trading Strategy:
SELL: 4078~4085.
BUY: 4005~4000.
More Analysis →
Daily Resistance: 4150, Support: 4000
4-Hour Resistance: 4110, Support: 4010
1-Hour Resistance: 4085, Support: 4020
Technically, the weekly chart is likely to close with a doji today. Yesterday's daily chart closed with a doji, indicating a slowdown in the short-term upward trend and exacerbating the expectation of sideways consolidation. The Bollinger Bands are also narrowing, and the effectiveness of the 4040 support level needs to be monitored today. Meanwhile, the 4000 level is being tested again. If 4020 is broken, a short-term sell signal can be adopted. If the price can hold above 4085, a buy signal can be adopted, with the 4140/4150 area to be watched again. Long-term holders can still look for buying opportunities around the 3930/3920 level;
Looking at the 1-hour chart, gold rebounded after the European session, but after breaking below 4080, there's a possibility of further downside in the short term. Watch for support around 4020;
For the European and American sessions, the plan is to consider buying if a stabilization signal appears around 4005/4000.
Trading Strategy:
SELL: 4078~4085.
BUY: 4005~4000.
More Analysis →
Trade active
The short-term downtrend line at 4085 is working. Is anyone else bearish like me? 💥Telegram Channel Free Updates 👉🏻
💥This a place for learning and communication. 👉🏻
💥Provide trading guidance.👉🏻
Telegram Channel👉🏻t.me/Actuary00group
💥This a place for learning and communication. 👉🏻
💥Provide trading guidance.👉🏻
Telegram Channel👉🏻t.me/Actuary00group
Disclaimer
The information and publications are not meant to be, and do not constitute, financial, investment, trading, or other types of advice or recommendations supplied or endorsed by TradingView. Read more in the Terms of Use.
💥Telegram Channel Free Updates 👉🏻
💥This a place for learning and communication. 👉🏻
💥Provide trading guidance.👉🏻
Telegram Channel👉🏻t.me/Actuary00group
💥This a place for learning and communication. 👉🏻
💥Provide trading guidance.👉🏻
Telegram Channel👉🏻t.me/Actuary00group
Disclaimer
The information and publications are not meant to be, and do not constitute, financial, investment, trading, or other types of advice or recommendations supplied or endorsed by TradingView. Read more in the Terms of Use.