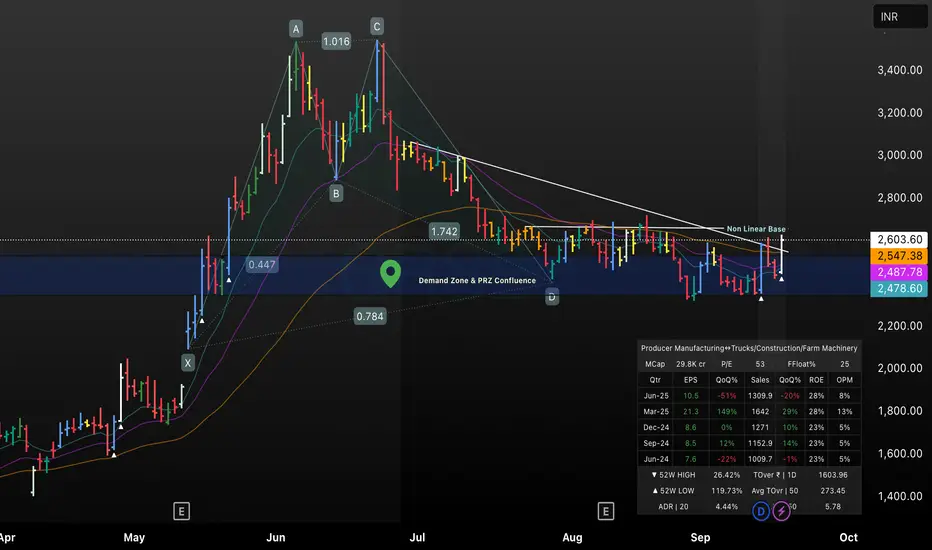
This TradingView chart presents the price action of GRSE, highlighting a demand zone and PRZ confluence area where the price reacted strongly before advancing to a Nonlinear Base resistance. The chart features a bullish breakout above key moving averages and trendlines, supported by volume and EPS growth data. Technical overlays include harmonic pattern completion, multi-timeframe support, and a clear visual of recent momentum shift, making this setup ideal for swing traders seeking confirmation in price-volume synergy and fundamental strength.
Disclaimer
The information and publications are not meant to be, and do not constitute, financial, investment, trading, or other types of advice or recommendations supplied or endorsed by TradingView. Read more in the Terms of Use.
Disclaimer
The information and publications are not meant to be, and do not constitute, financial, investment, trading, or other types of advice or recommendations supplied or endorsed by TradingView. Read more in the Terms of Use.