📈 Key Technical Levels for the Week
Resistance Levels:
R1: ₹1,005.43
R2: ₹1,021.02
R3: ₹1,034.00
Support Levels:
S1: ₹965.32
S2: ₹949.73
S3: ₹937.47
A close above ₹1,005.43 could indicate a breakout, while a drop below ₹965.32 may signal a potential reversal.
📊 Technical Indicators
RSI (14): 77.88 — Overbought, suggesting potential for a pullback.
MACD: Positive, indicating bullish momentum.
CCI: 202.29 — Overbought, aligning with the RSI reading.
ADX: 32.18 — Bullish trend strength.
The stock is trading above its 20-day and 50-day moving averages, indicating a bullish trend.
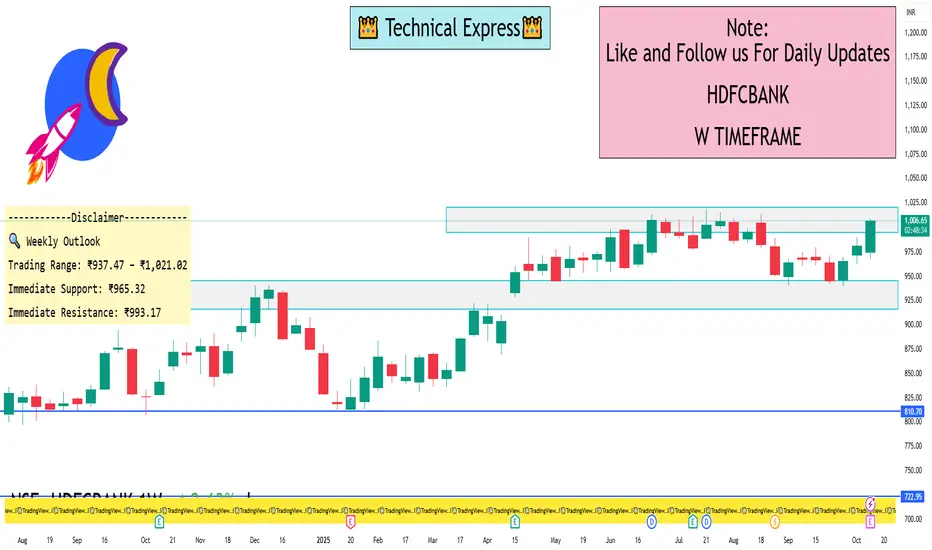
🔍 Weekly Outlook
Trading Range: ₹937.47 – ₹1,021.02
Immediate Support: ₹965.32
Immediate Resistance: ₹993.17
A close above ₹1,005.43 could lead to further gains, while a close below ₹965.32 may suggest a bearish reversal.
Resistance Levels:
R1: ₹1,005.43
R2: ₹1,021.02
R3: ₹1,034.00
Support Levels:
S1: ₹965.32
S2: ₹949.73
S3: ₹937.47
A close above ₹1,005.43 could indicate a breakout, while a drop below ₹965.32 may signal a potential reversal.
📊 Technical Indicators
RSI (14): 77.88 — Overbought, suggesting potential for a pullback.
MACD: Positive, indicating bullish momentum.
CCI: 202.29 — Overbought, aligning with the RSI reading.
ADX: 32.18 — Bullish trend strength.
The stock is trading above its 20-day and 50-day moving averages, indicating a bullish trend.
🔍 Weekly Outlook
Trading Range: ₹937.47 – ₹1,021.02
Immediate Support: ₹965.32
Immediate Resistance: ₹993.17
A close above ₹1,005.43 could lead to further gains, while a close below ₹965.32 may suggest a bearish reversal.
I built a Buy & Sell Signal Indicator with 85% accuracy.
📈 Get access via DM or
WhatsApp: wa.link/d997q0
Contact - +91 76782 40962
| Email: techncialexpress@gmail.com
| Script Coder | Trader | Investor | From India
📈 Get access via DM or
WhatsApp: wa.link/d997q0
Contact - +91 76782 40962
| Email: techncialexpress@gmail.com
| Script Coder | Trader | Investor | From India
Related publications
Disclaimer
The information and publications are not meant to be, and do not constitute, financial, investment, trading, or other types of advice or recommendations supplied or endorsed by TradingView. Read more in the Terms of Use.