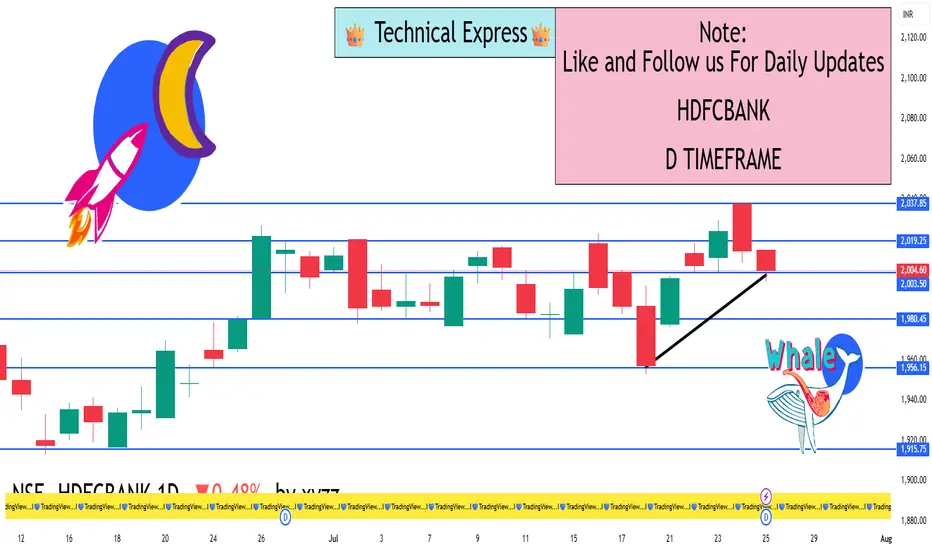
Closing Price: ₹2,004.60
Opening Price: ₹2,018.80
Day’s High: ₹2,028.00
Day’s Low: ₹1,996.75
Net Change: –₹16.10 (–0.80%)
Trend: Mild Bearish
🔻 Support Levels
₹1,985 – Immediate support (20-day moving average)
₹1,950 – Short-term support (50-day moving average)
₹1,910 – Medium support (100-day moving average)
🔺 Resistance Levels
₹2,030 – Recent swing high and near-term resistance
₹2,050 – Breakout zone if momentum picks up
₹2,100 – Major resistance area
📈 Technical Indicators
RSI (Relative Strength Index): ~62
➤ In neutral to bullish territory, showing healthy momentum but close to overbought levels.
MACD (Moving Average Convergence Divergence):
➤ MACD line above Signal line – currently a bullish signal.
Volume:
➤ Normal trading volume; no heavy buying or panic selling.
➤ Indicates steady participation from both retail and institutional investors.
Candlestick Pattern:
➤ Small bearish candle after a strong bullish move earlier in the week.
➤ Indicates temporary profit booking or hesitation near resistance zone.
🧠 Market Sentiment
Overall sentiment remains positive for HDFC Bank due to:
Strong financials and balance sheet
Good loan growth reported in recent results
High investor confidence post bonus issue announcement
However, profit booking is likely near ₹2,030 as it is a psychological and technical resistance.
✅ Conclusion
Short-Term View: Mild pullback within an uptrend; no major weakness.
Medium-Term Trend: Still bullish as price remains above key moving averages.
Action to Watch:
A breakout above ₹2,030 may trigger a rally toward ₹2,050+.
A drop below ₹1,985 may invite short-term selling toward ₹1,950.
I built a Buy & Sell Signal Indicator with 85% accuracy.
📈 Get access via DM or
WhatsApp: wa.link/d997q0
Contact - +91 76782 40962
| Email: techncialexpress@gmail.com
| Script Coder | Trader | Investor | From India
📈 Get access via DM or
WhatsApp: wa.link/d997q0
Contact - +91 76782 40962
| Email: techncialexpress@gmail.com
| Script Coder | Trader | Investor | From India
Related publications
Disclaimer
The information and publications are not meant to be, and do not constitute, financial, investment, trading, or other types of advice or recommendations supplied or endorsed by TradingView. Read more in the Terms of Use.