1. Pattern Analysis
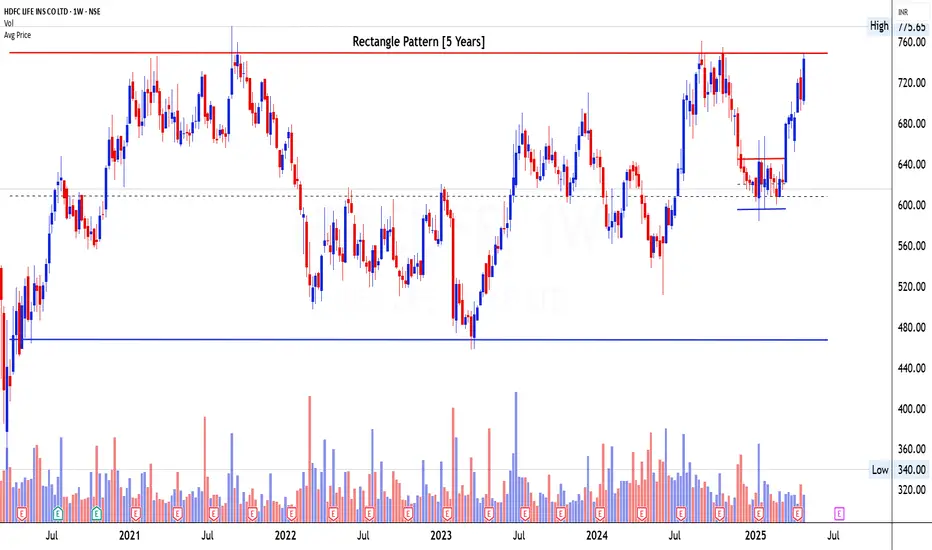
The chart exhibits a Rectangle Pattern that has been developing over the last 5 years, making it a valid and high-conviction structure. The price has moved within a well-defined horizontal range, with resistance at around ₹775 and support near ₹475. This long consolidation zone indicates a prolonged phase of accumulation, where buyers and sellers have been in equilibrium. The price is currently hovering just below the upper boundary of the rectangle, and a breakout from this zone could mark the beginning of a multi-year bullish trend.
2. Volume Analysis
Volume activity throughout the pattern has remained consistent, with notable surges during rallies from the lower boundary. Recently, the stock has shown an increase in volume alongside a rally towards the resistance zone, indicating active participation from buyers. This uptick in volume is essential as the price approaches the breakout zone, hinting at potential bullish strength building up. The base volumes have not deteriorated, reflecting long-term investor interest.
3. Candlestick or Price Analysis
Recent candlestick formations are predominantly bullish, marked by strong-bodied candles with relatively small wicks, showing buying dominance. There has been a sharp move from the ₹600 level toward the current resistance, and the strength of the move suggests buyers are preparing for a test of the breakout zone. There have been no signs of exhaustion candles near the resistance so far, and price rejection from the lower boundary in early 2025 adds further strength to the bullish case.
4. Validation of Signal
Although the price is yet to conclusively break out of the ₹775 resistance level, the combination of strong volume, bullish price structure, and a 5-year-old base confirms that this is a valid bullish setup in its final stage of confirmation. A clean weekly close above ₹775 on strong volume would be the final trigger for confirmation. Until then, traders should prepare for a breakout but not pre-empt it. If the stock fails to break out and gets rejected, the pattern remains valid unless the lower end is breached.
5. Tradable Points Determination
Entry Point Determination: The optimal entry would be above ₹775 on a confirmed weekly breakout with strong volume. Pre-breakout entries can only be considered on intraday dips with small quantities for high-risk players, but conservative traders should wait for a breakout candle.
Target Point Determination: The rectangle height is approximately ₹300 (₹775 - ₹475). Upon a breakout, this height can be projected from the breakout zone, giving a medium-term target of ₹1,075. This aligns with historical volatility potential.
Stop Loss Placement and Trailing SL Follow-Up: A logical stop loss should be placed below the breakout candle or last swing low (₹720 zone) for breakout traders. Once price sustains above ₹800, traders can shift to a trailing stop-loss method, locking in profits gradually as the move unfolds. Trail based on weekly closing lows or use a 20-period EMA for medium-term trend capture.
Learn Today for Better Tomorrow
Disclaimer
The information and publications are not meant to be, and do not constitute, financial, investment, trading, or other types of advice or recommendations supplied or endorsed by TradingView. Read more in the Terms of Use.
Learn Today for Better Tomorrow
Disclaimer
The information and publications are not meant to be, and do not constitute, financial, investment, trading, or other types of advice or recommendations supplied or endorsed by TradingView. Read more in the Terms of Use.