Here’s a detailed **technical summary and analysis** of the Hindustan Zinc Ltd. (HINDZINC) chart you shared:
---
### **Chart Pattern & Setup:**
✅ **Rectangular Consolidation / Range Breakout:**
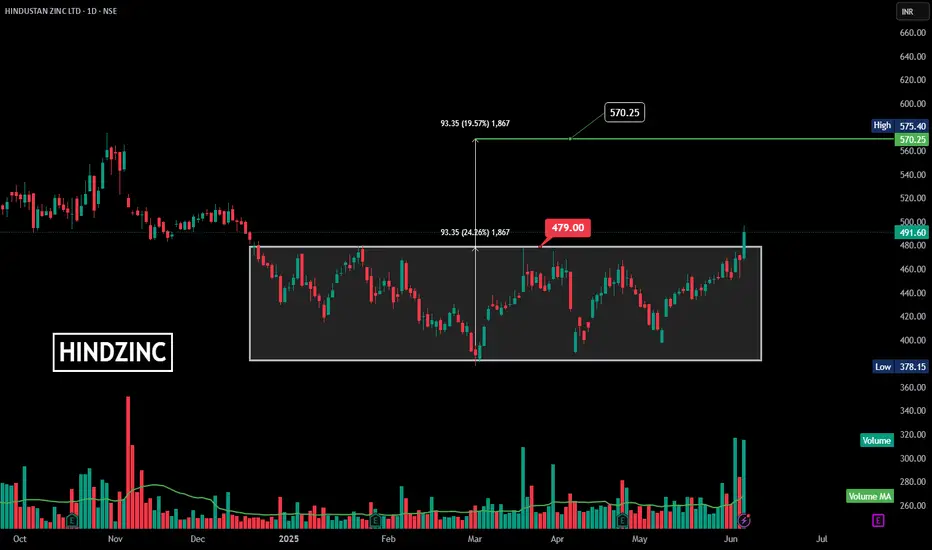
* The stock has been trading within a range (rectangle) from approximately **378.15 (low)** to **479.00 (resistance)** for several months (since December 2024).
* This consolidation pattern signifies **accumulation**.
✅ **Breakout:**
* Price action has decisively broken out of the **rectangle’s upper boundary at 479.00 INR**.
* **Current price:** 491.60 INR, showing bullish momentum.
---
### **Measured Move & Target:**
* The height of the range (rectangle) is **93.35 INR** (24.26% move).
* **Target Calculation:**
$\text{Breakout Level (479)} + \text{Height (93.35)} = \approx \textbf{570.25 INR}$.
* Immediate resistance level is around 570-575 INR.
---
### **Volume Analysis:**
✅ A **significant spike in volume** confirms the breakout, validating the buying interest.
✅ The **Volume MA line** is also trending up, showing sustained interest.
---
### **Key Levels:**
* **Resistance (Breakout level):** 479.00 INR
* **Target:** 570.25 INR
* **Current Price:** 491.60 INR
* **Immediate support:** 479.00 INR
* **Low support:** 378.15 INR
---
### **Conclusion & Trade Idea:**
This breakout from a **rectangle consolidation** is a strong bullish signal, especially with the volume confirmation. If the price sustains above 479 INR, the next likely target is **570-575 INR**.
---
Would you like me to:
✅ Create a YouTube video title and description with these details?
✅ Suggest a possible trading plan or risk management idea?
✅ Generate hashtags for maximum YouTube SEO visibility?
Let me know! 🚀✨
---
### **Chart Pattern & Setup:**
✅ **Rectangular Consolidation / Range Breakout:**
* The stock has been trading within a range (rectangle) from approximately **378.15 (low)** to **479.00 (resistance)** for several months (since December 2024).
* This consolidation pattern signifies **accumulation**.
✅ **Breakout:**
* Price action has decisively broken out of the **rectangle’s upper boundary at 479.00 INR**.
* **Current price:** 491.60 INR, showing bullish momentum.
---
### **Measured Move & Target:**
* The height of the range (rectangle) is **93.35 INR** (24.26% move).
* **Target Calculation:**
$\text{Breakout Level (479)} + \text{Height (93.35)} = \approx \textbf{570.25 INR}$.
* Immediate resistance level is around 570-575 INR.
---
### **Volume Analysis:**
✅ A **significant spike in volume** confirms the breakout, validating the buying interest.
✅ The **Volume MA line** is also trending up, showing sustained interest.
---
### **Key Levels:**
* **Resistance (Breakout level):** 479.00 INR
* **Target:** 570.25 INR
* **Current Price:** 491.60 INR
* **Immediate support:** 479.00 INR
* **Low support:** 378.15 INR
---
### **Conclusion & Trade Idea:**
This breakout from a **rectangle consolidation** is a strong bullish signal, especially with the volume confirmation. If the price sustains above 479 INR, the next likely target is **570-575 INR**.
---
Would you like me to:
✅ Create a YouTube video title and description with these details?
✅ Suggest a possible trading plan or risk management idea?
✅ Generate hashtags for maximum YouTube SEO visibility?
Let me know! 🚀✨
Disclaimer
The information and publications are not meant to be, and do not constitute, financial, investment, trading, or other types of advice or recommendations supplied or endorsed by TradingView. Read more in the Terms of Use.
Disclaimer
The information and publications are not meant to be, and do not constitute, financial, investment, trading, or other types of advice or recommendations supplied or endorsed by TradingView. Read more in the Terms of Use.