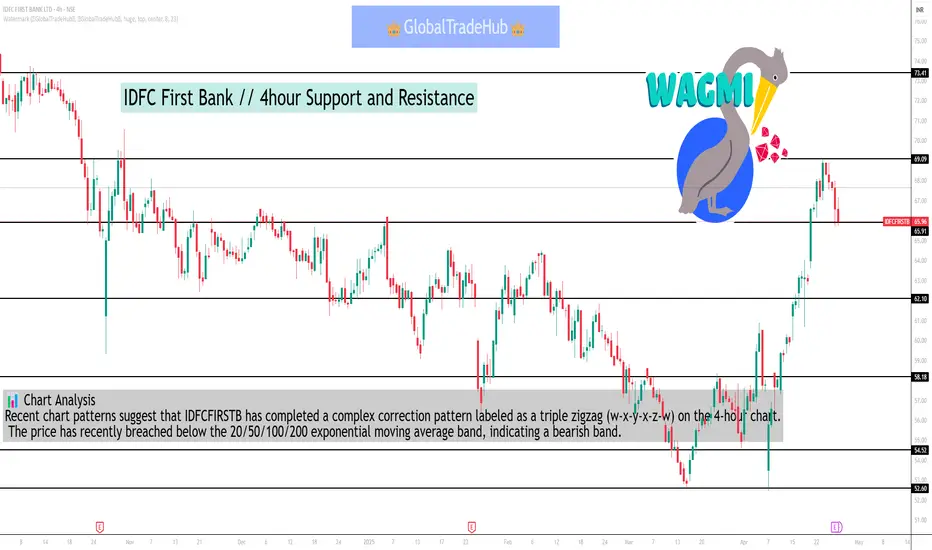
📈 4-Hour Support & Resistance Levels
Based on recent intraday analysis, the key support and resistance levels for IDFCFIRSTB on a 4-hour chart are:
Support Levels:
₹59.89 (S1)
₹59.15 (S2)
₹58.17 (S3)
Resistance Levels:
₹61.61
₹62.59
₹63.33
These levels are derived from the recent price action and can serve as potential entry or exit points for intraday traders.
🔍 Technical Indicators Overview
Relative Strength Index (RSI): Currently at 39.67, indicating a potential oversold condition and possible reversal if the price holds above key support levels.
Moving Averages:
20-day EMA: ₹56.78
50-day EMA: ₹58.88
100-day EMA: ₹61.87
200-day EMA: ₹66.42
The current price is below these moving averages, suggesting a bearish short-term trend.
Average True Range (ATR): 1.92, indicating moderate volatility.
📊 Chart Analysis
Recent chart patterns suggest that IDFCFIRSTB has completed a complex correction pattern labeled as a triple zigzag (w-x-y-x-z-w) on the 4-hour chart. The price has recently breached below the 20/50/100/200 exponential moving average band, indicating a bearish trend.
✅ Trading Strategy
Bullish Scenario: A break above ₹61.61 (R1) with sustained momentum could lead to a rally towards ₹62.59 (R2) and ₹63.33 (R3).
Bearish Scenario: A drop below ₹59.89 (S1) may accelerate the decline towards ₹58.17 (S3).
It's advisable to monitor volume and candlestick patterns for confirmation of breakout or breakdown.
Related publications
Disclaimer
The information and publications are not meant to be, and do not constitute, financial, investment, trading, or other types of advice or recommendations supplied or endorsed by TradingView. Read more in the Terms of Use.
Related publications
Disclaimer
The information and publications are not meant to be, and do not constitute, financial, investment, trading, or other types of advice or recommendations supplied or endorsed by TradingView. Read more in the Terms of Use.