From 2000 to 2020
Over period of 20 Years ( Observe The Marked Circles)
Infosys on Monthly TF has Bounced And Rallied Sharply Everytime it has Touched 88 ~ 100 MEMA after Crossing the 20-50 MEMA and has traded in a Parallel Channel which provides a Stable And Solid Structure to Match the Fundamental Growth of the Stock.
Ever Since The Mega Breakout of 2020 after crossing 1.618 Fib Extension of the Rally that began in 2000

We have Upgraded the Channel
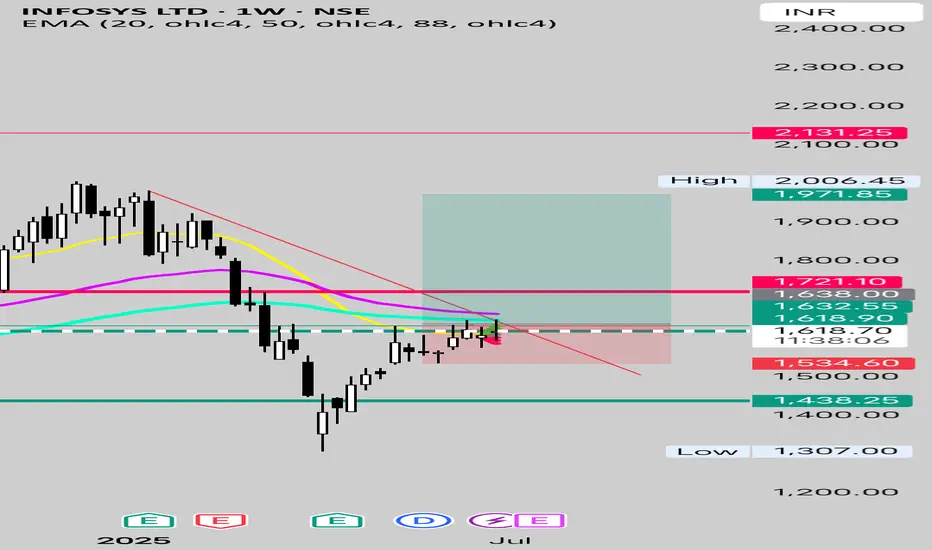
We are Near the Trendline and have been consolidating for about 8 Weeks without any signs of Bearishness.
This Prolonged consolidation followed by Trendline break and Historical Higher Monthly TF Support makes good case for Potential Upside of about 30% from CMP 1618 which will gain momentum above 1720.
Targeting 2000~2100 which happens to coincide with Upper End of the Parallel Channel

Look for the Inv Head and Shoulder in Formation in Short term for Swing Trade
Hereby Sharing a Short term Potential Trade with Longer Term Perspective in The Description above.
Buy Above 1638
SL below 1530
TP 1950~ 2000
R:R = 3
Over period of 20 Years ( Observe The Marked Circles)
Infosys on Monthly TF has Bounced And Rallied Sharply Everytime it has Touched 88 ~ 100 MEMA after Crossing the 20-50 MEMA and has traded in a Parallel Channel which provides a Stable And Solid Structure to Match the Fundamental Growth of the Stock.
Ever Since The Mega Breakout of 2020 after crossing 1.618 Fib Extension of the Rally that began in 2000
We have Upgraded the Channel
We are Near the Trendline and have been consolidating for about 8 Weeks without any signs of Bearishness.
This Prolonged consolidation followed by Trendline break and Historical Higher Monthly TF Support makes good case for Potential Upside of about 30% from CMP 1618 which will gain momentum above 1720.
Targeting 2000~2100 which happens to coincide with Upper End of the Parallel Channel
Look for the Inv Head and Shoulder in Formation in Short term for Swing Trade
Hereby Sharing a Short term Potential Trade with Longer Term Perspective in The Description above.
Buy Above 1638
SL below 1530
TP 1950~ 2000
R:R = 3
Trade active
Trade Activated above 1638 💥Disclaimer
The information and publications are not meant to be, and do not constitute, financial, investment, trading, or other types of advice or recommendations supplied or endorsed by TradingView. Read more in the Terms of Use.
Disclaimer
The information and publications are not meant to be, and do not constitute, financial, investment, trading, or other types of advice or recommendations supplied or endorsed by TradingView. Read more in the Terms of Use.