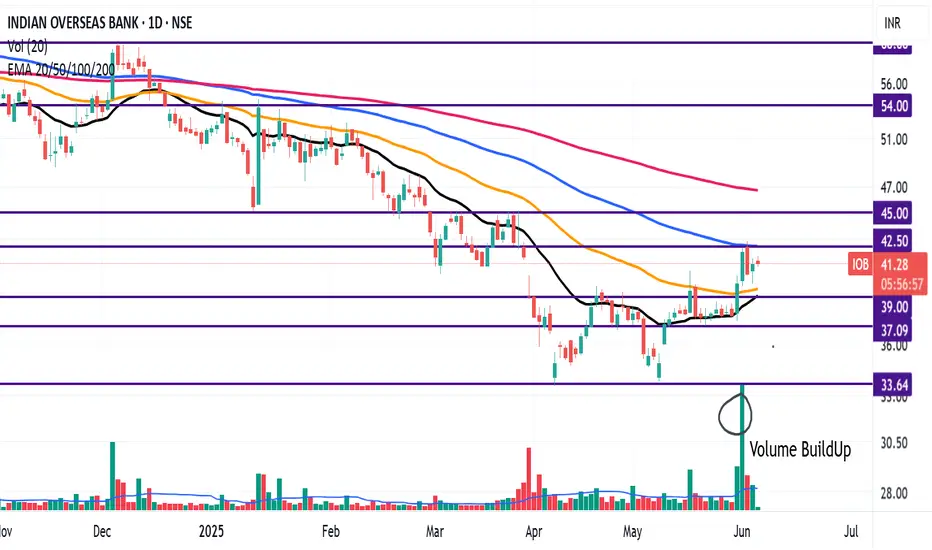
IOB is trading above 20 EMA (black Line), 50 EMA (Orange Line), and nearing the 100 EMAs (Blue Line) However, it is well below the 200 EMA (Pink line).
Recently the stock turned bullish, after taking support around 20EMA.
Volume Buildup also confirms the change in trend.
We have seen spurt in volume in the last few sessions, however, on weekly chart the 20 EMA (Black line) has to traverse above the 50 EMA (Orange line) to confirm the Bullish trend.
Resistance levels: 43, 45, 53, 60
Support levels: 39, 37, 33
Disclaimer
The information and publications are not meant to be, and do not constitute, financial, investment, trading, or other types of advice or recommendations supplied or endorsed by TradingView. Read more in the Terms of Use.
Disclaimer
The information and publications are not meant to be, and do not constitute, financial, investment, trading, or other types of advice or recommendations supplied or endorsed by TradingView. Read more in the Terms of Use.