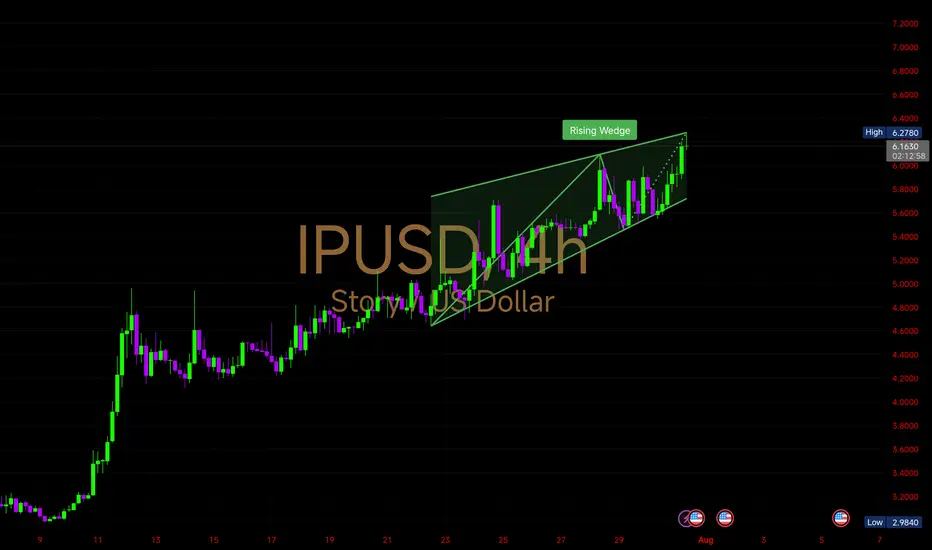
🌀 Wave Structure So Far:
(1) & (2): Clean initiation phase with higher lows
(3): Strong impulsive move peaking near $0.436
(4): Healthy retracement with consolidation
(5): Projected at 1.618 Fib Extension → $0.4415, signaling a potential short-term breakout if momentum holds
• Price currently stabilizing above $0.420
• Low Volatility Zone between wave (4) and projected (5) suggests coiling action before next leg
• RSI and volume should be watched for breakout confirmation
This setup favors momentum traders and scalpers as wave (5) formation could trigger a quick rally if $0.423–$0.425 resistance clears with volume.
However, failure to hold above $0.418 could delay the wave count or invalidate the current projection.
https://www.tradingview.com/x/q5i6f3Mm
Disclaimer
The information and publications are not meant to be, and do not constitute, financial, investment, trading, or other types of advice or recommendations supplied or endorsed by TradingView. Read more in the Terms of Use.
Disclaimer
The information and publications are not meant to be, and do not constitute, financial, investment, trading, or other types of advice or recommendations supplied or endorsed by TradingView. Read more in the Terms of Use.
