📉 Today’s Price Action
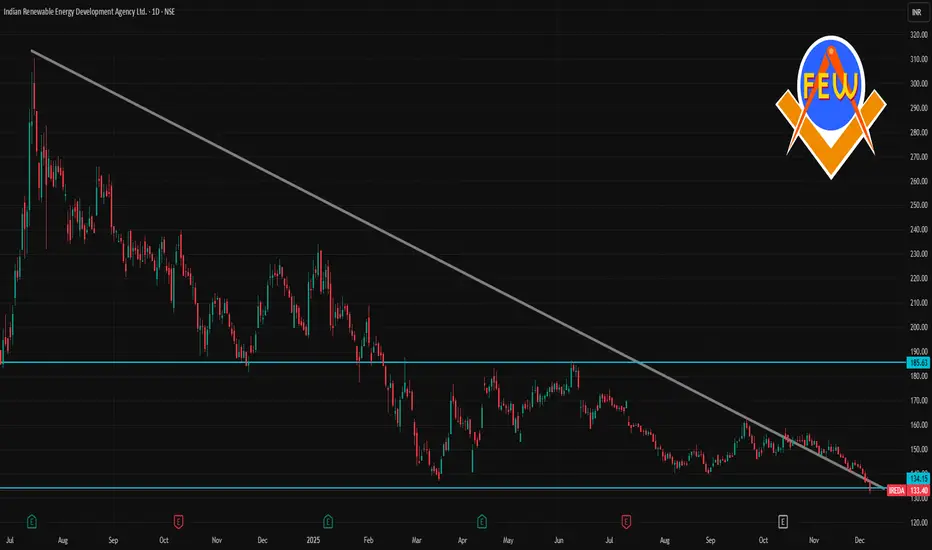
Last traded price: ₹ 133.40
Day’s range: ₹ 132.00 – ₹ 137.29
Change vs previous close: – ₹ 3.35 (–2.45%)
📊 Key Context & Technical Snapshot
Metric / Indicator Value / Observation
52-week range ₹ 132.00 — ₹ 234.29
Relative valuation P/E ~ 21.7 ×
Market cap ~ ₹ 37,475 Cr
Recent momentum 1-week: –6.65%, 1-month: –11.66%
Volatility (ATR) ATR (5-day) ≈ ₹ 3.4
Interpretation (short-term / 1-day):
The stock is near its 52-week low zone — so the current level (~₹133) is close to its recent bottom band.
The drop today suggests selling pressure, but the intraday range shows some trading / bounce between ₹132–₹137.
Given the volatility (as indicated by ATR) and recent downward momentum, the stock looks “soft” in the very short term.
Related publications
Disclaimer
The information and publications are not meant to be, and do not constitute, financial, investment, trading, or other types of advice or recommendations supplied or endorsed by TradingView. Read more in the Terms of Use.
Related publications
Disclaimer
The information and publications are not meant to be, and do not constitute, financial, investment, trading, or other types of advice or recommendations supplied or endorsed by TradingView. Read more in the Terms of Use.