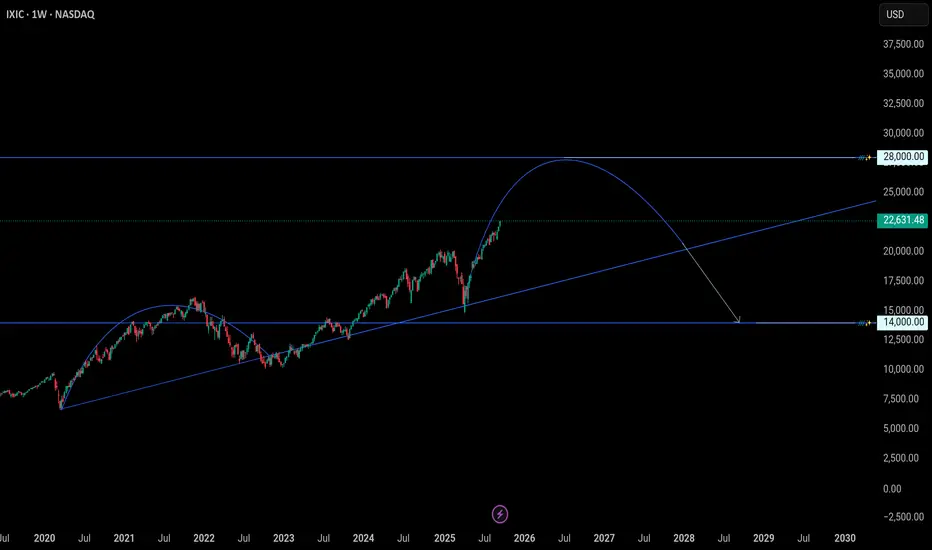
The weekly NASDAQ Composite (IXIC) chart shows a strong uptrend, Price action has respected a long-term ascending support line and is approaching the next key resistance near 28,000. The overlaid arc suggests a possible medium-term rally toward that 28,000 zone before a significant pullback, potentially toward 14,000, which aligns with a major support.
Disclaimer
The information and publications are not meant to be, and do not constitute, financial, investment, trading, or other types of advice or recommendations supplied or endorsed by TradingView. Read more in the Terms of Use.
Disclaimer
The information and publications are not meant to be, and do not constitute, financial, investment, trading, or other types of advice or recommendations supplied or endorsed by TradingView. Read more in the Terms of Use.