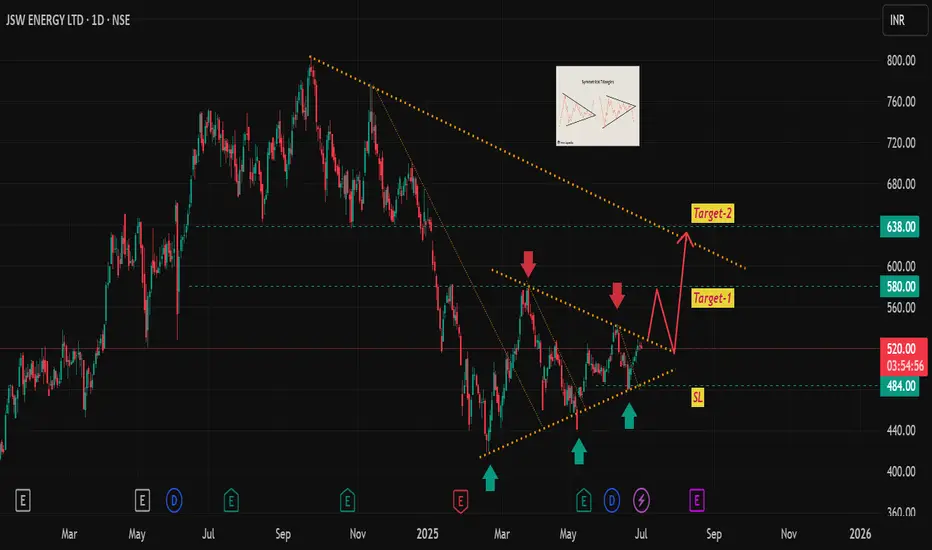
JSW Energy - under the formation of symmetric triangle chart pattern, it is near to breakout level, one can go long (short term) here, stop loss and targets are mentioned in the chart.
Please note: I am not a certified stock analyst, this chart is purely for education purpose, request you to do your own financial assessment before investment/trade.
Please note: I am not a certified stock analyst, this chart is purely for education purpose, request you to do your own financial assessment before investment/trade.
Disclaimer
The information and publications are not meant to be, and do not constitute, financial, investment, trading, or other types of advice or recommendations supplied or endorsed by TradingView. Read more in the Terms of Use.
Disclaimer
The information and publications are not meant to be, and do not constitute, financial, investment, trading, or other types of advice or recommendations supplied or endorsed by TradingView. Read more in the Terms of Use.