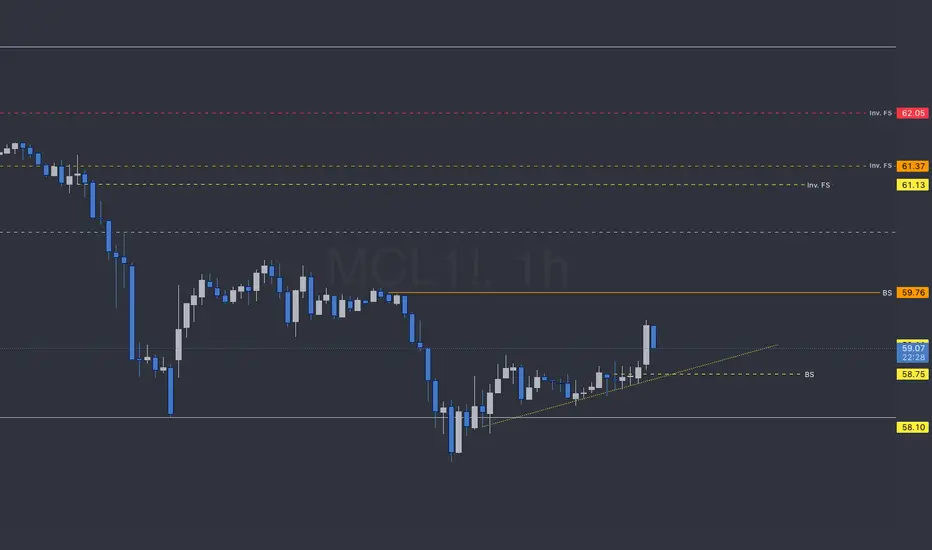
Just an hourly chart with levels from above this timeframe.
year = black
pink = month
red= day
4hr = orange
1hr = yellow
year = black
pink = month
red= day
4hr = orange
1hr = yellow
Trade closed: target reached
not the best chart but the levels have performed their duties. Disclaimer
The information and publications are not meant to be, and do not constitute, financial, investment, trading, or other types of advice or recommendations supplied or endorsed by TradingView. Read more in the Terms of Use.
Disclaimer
The information and publications are not meant to be, and do not constitute, financial, investment, trading, or other types of advice or recommendations supplied or endorsed by TradingView. Read more in the Terms of Use.