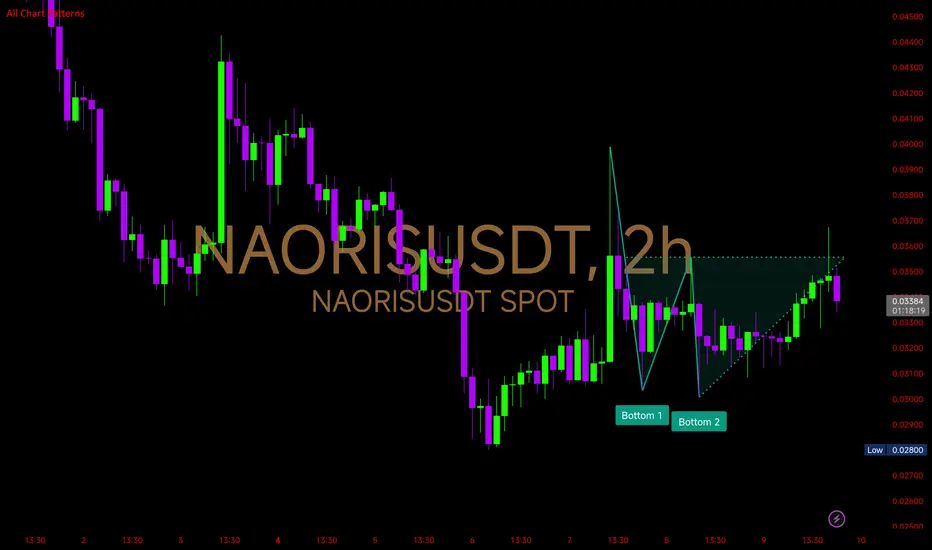
Chart is showing a well-defined Falling Wedge — a bullish reversal pattern that forms as price makes lower highs and lower lows, but within converging trendlines. This typically signals selling pressure is weakening and a potential breakout is brewing.
🔸The wedge formed after a sharp upward impulse from ~0.052 to 0.084, indicating the move is likely a corrective phase rather than a full reversal.
Support Zone: 0.058–0.060 is acting as the lower wedge boundary and key short-term demand zone. Multiple touches here without breakdown suggest buyers are quietly absorbing supply.
Resistance Zone: 0.064–0.065 is the upper wedge line. A decisive breakout with volume above this could trigger momentum buying.
Probable Scenarios
1. Bullish Breakout: A close above 0.065 with rising volume would confirm the wedge breakout. Historically, this pattern often leads to a retest of the prior swing high (~0.084).
Momentum indicators would likely flip bullish post-breakout.
2. False Break & Retest: Price could attempt a breakout but reject, retesting the 0.060 base before making another attempt. This is common in wedge setups.
3. Bearish Breakdown: If 0.058 fails with strong sell volume, price could revisit the 0.052–0.050 zone (previous accumulation range).
The falling wedge is nearing its apex — meaning a decisive move is close. Given the preceding uptrend, probability leans bullish, but confirmation will only come with a high-volume break above resistance. Until then, patience and level-by-level monitoring are crucial.
Disclaimer
The information and publications are not meant to be, and do not constitute, financial, investment, trading, or other types of advice or recommendations supplied or endorsed by TradingView. Read more in the Terms of Use.
Disclaimer
The information and publications are not meant to be, and do not constitute, financial, investment, trading, or other types of advice or recommendations supplied or endorsed by TradingView. Read more in the Terms of Use.
