The recent price action in Natural Gas is a textbook example of short-term optimism divorced from underlying fundamentals. While traders celebrate minor weather-related demand forecasts, the broader structure tells a different story — one of excess positioning and complacency.
1. Technical Overextension Disguised as Strength
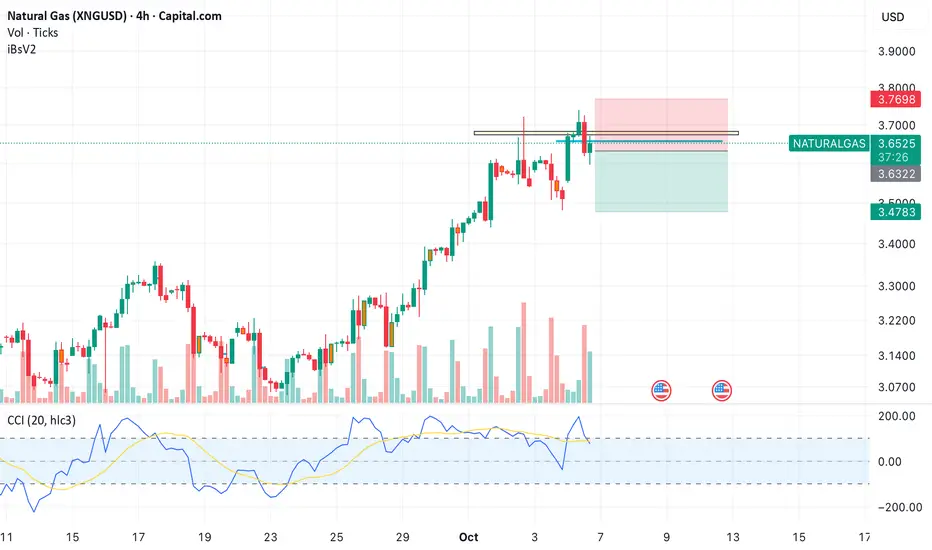
Natural Gas has rallied sharply over the last few sessions, but the 4-hour chart reveals critical fatigue near the 3.65–3.75 resistance band. This zone aligns with previous supply pockets and the upper boundary of the last major distribution phase.
• The CCI is rolling over from overbought levels.
• Volumes have thinned out despite higher prices, indicating smart money exiting quietly.
• The most recent candle formation shows clear rejection, suggesting failed attempts to hold above the breakout point.
Such structures rarely sustain without meaningful follow-through volume. This is a market running on fumes, not on fundamentals.
2. Fundamental Dissonance
On the macro front, the narrative doesn’t justify the rally:
• Storage levels in the U.S. remain above the 5-year average, implying no genuine supply stress.
• Mild weather forecasts across key consuming regions reduce the probability of significant short-term demand spikes.
• LNG export growth, while a supportive long-term story, has already been priced in by speculative traders.
In essence, the market is reacting to marginal bullish headlines while ignoring the broader supply overhang. The structural imbalance remains — and it favors lower prices once speculative positioning unwinds.
3. Behavioral Mispricing and Market Psychology
Markets often repeat a familiar behavioral pattern:
• Retail enthusiasm builds on narratives of “early winter demand.”
• Hedge funds chase momentum, ignoring inventory and weather convergence data.
• The setup peaks when conviction is highest and that’s exactly what the price structure at 3.70–3.75 is signaling now.
4. Trade Structure and Risk Framework
• Sell Zone: Below 3.63
• Stop Loss: 3.77 (above structural rejection)
• Targets: 3.40 (first target), 3.25 (extended move)
• Risk–Reward: Approximately 1:2.5, highly asymmetric.
If the correction gains traction, a break below 3.40 could accelerate profit-taking, potentially dragging prices toward 3.20 levels as speculative longs unwind.
5. The Contrarian Premise
Natural Gas is pricing perfection ie the assumption that seasonal demand will spike and storage draws will tighten balances. The data doesn’t confirm it. This is a liquidity-driven bounce within a broader range-bound market, not the start of a structural uptrend. When fundamentals contradict price, the correction is only a matter of timing, not probability.
1. Technical Overextension Disguised as Strength
Natural Gas has rallied sharply over the last few sessions, but the 4-hour chart reveals critical fatigue near the 3.65–3.75 resistance band. This zone aligns with previous supply pockets and the upper boundary of the last major distribution phase.
• The CCI is rolling over from overbought levels.
• Volumes have thinned out despite higher prices, indicating smart money exiting quietly.
• The most recent candle formation shows clear rejection, suggesting failed attempts to hold above the breakout point.
Such structures rarely sustain without meaningful follow-through volume. This is a market running on fumes, not on fundamentals.
2. Fundamental Dissonance
On the macro front, the narrative doesn’t justify the rally:
• Storage levels in the U.S. remain above the 5-year average, implying no genuine supply stress.
• Mild weather forecasts across key consuming regions reduce the probability of significant short-term demand spikes.
• LNG export growth, while a supportive long-term story, has already been priced in by speculative traders.
In essence, the market is reacting to marginal bullish headlines while ignoring the broader supply overhang. The structural imbalance remains — and it favors lower prices once speculative positioning unwinds.
3. Behavioral Mispricing and Market Psychology
Markets often repeat a familiar behavioral pattern:
• Retail enthusiasm builds on narratives of “early winter demand.”
• Hedge funds chase momentum, ignoring inventory and weather convergence data.
• The setup peaks when conviction is highest and that’s exactly what the price structure at 3.70–3.75 is signaling now.
4. Trade Structure and Risk Framework
• Sell Zone: Below 3.63
• Stop Loss: 3.77 (above structural rejection)
• Targets: 3.40 (first target), 3.25 (extended move)
• Risk–Reward: Approximately 1:2.5, highly asymmetric.
If the correction gains traction, a break below 3.40 could accelerate profit-taking, potentially dragging prices toward 3.20 levels as speculative longs unwind.
5. The Contrarian Premise
Natural Gas is pricing perfection ie the assumption that seasonal demand will spike and storage draws will tighten balances. The data doesn’t confirm it. This is a liquidity-driven bounce within a broader range-bound market, not the start of a structural uptrend. When fundamentals contradict price, the correction is only a matter of timing, not probability.
Trade closed: stop reached
SL Hit but setup is still slightly negative.Note
Shorters can still hold out for another few candles. Disclaimer
The information and publications are not meant to be, and do not constitute, financial, investment, trading, or other types of advice or recommendations supplied or endorsed by TradingView. Read more in the Terms of Use.
Disclaimer
The information and publications are not meant to be, and do not constitute, financial, investment, trading, or other types of advice or recommendations supplied or endorsed by TradingView. Read more in the Terms of Use.