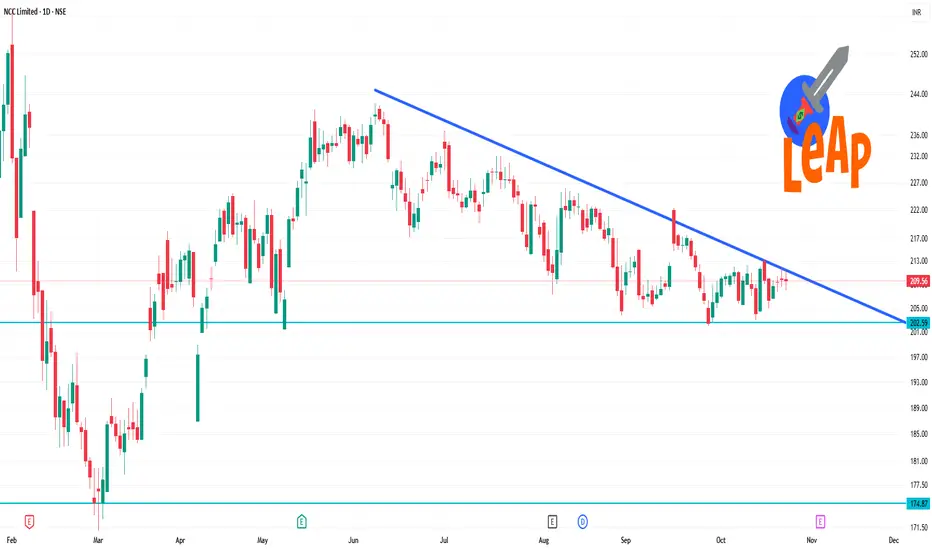
✅ Key data & current state
The stock is trading around ~₹ 206-₹ 209 as quoted recently.
On the daily chart:
14-day RSI is ~54 (neutral zone) according to one source.
Moving averages: 5-day MA ~208.19, 50-day ~208.28 (both slightly above current price) → bullish sign short term.
200-day MA ~209.77 is slightly above current price, meaning price is just below a longer-term average.
Technical indicators show mixed signals: some “buy” signals from moving averages, but overall “neutral” from aggregate indicators.
Related publications
Disclaimer
The information and publications are not meant to be, and do not constitute, financial, investment, trading, or other types of advice or recommendations supplied or endorsed by TradingView. Read more in the Terms of Use.
Related publications
Disclaimer
The information and publications are not meant to be, and do not constitute, financial, investment, trading, or other types of advice or recommendations supplied or endorsed by TradingView. Read more in the Terms of Use.