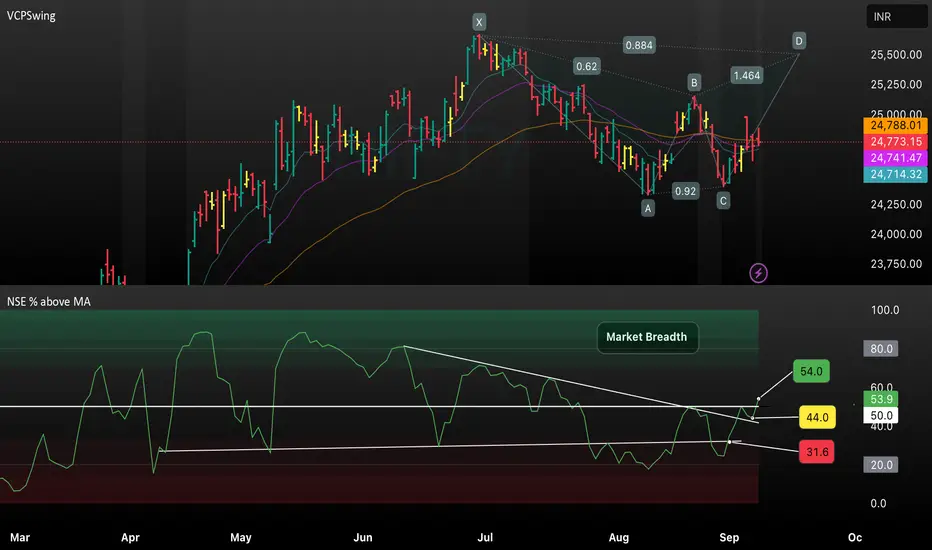
This TradingView chart analyzes the NSE Index with a focus on market breadth, highlighting the percentage of stocks above their moving averages. The chart showcases a recent breakout above key breadth levels (44.0 and 50.0), signaling improving momentum and a potential trend reversal. Visual trendlines track advancing participation, offering insight into market strength and possible continuation if breadth values sustain above these thresholds. This setup helps traders identify early signs of bullish sentiment before price confirmation.
Disclaimer
The information and publications are not meant to be, and do not constitute, financial, investment, trading, or other types of advice or recommendations supplied or endorsed by TradingView. Read more in the Terms of Use.
Disclaimer
The information and publications are not meant to be, and do not constitute, financial, investment, trading, or other types of advice or recommendations supplied or endorsed by TradingView. Read more in the Terms of Use.