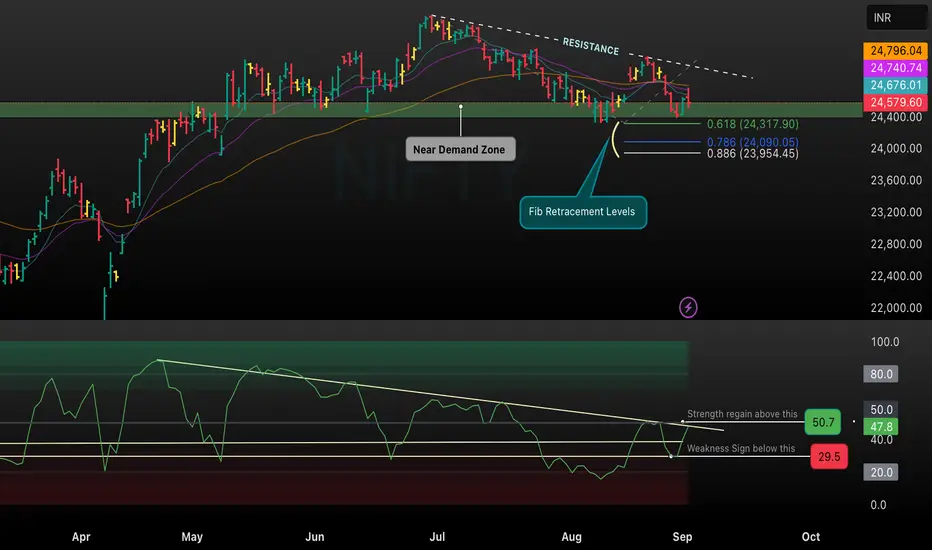
This chart shows NIFTY approaching a significant demand zone, highlighted by confluence of Fibonacci retracement levels (0.618, 0.786, and 0.886). Price action is observed correcting toward the support band, with major retracement levels at 24,317.90, 24,090.05, and 23,954.45 (shown in blue horizontal lines). The RSI panel below reflects a sustained downtrend but recently broke above a descending resistance line, showing a regain in strength above 50.7 while remaining weak below 29.5. This setup indicates that traders should monitor for bullish reversal signals at demand zone, validated by RSI strength above 50 for trend resumption or renewed weakness if it falls below 29.5.
Key Points Explained
Price Structure & Demand Zone
• Price is consolidating near a demand zone, as identified by the horizontal green band and annotation.
• Fibonacci retracement levels (0.618, 0.786, 0.886) provide potential reversal/support targets for bullish moves.
RSI (Relative Strength Index) Analysis
• The RSI trendline suggests historical weakness, with key zones for strength regain at 50.7 and weakness confirmation at 29.5.
• A recent break above the RSI trendline may indicate a possible reversal or end of weakness if sustained above 50.7.
Trading Setup
• Watch the demand zone and Fibonacci levels for bullish entries.
• Confirmation can be found if RSI sustains above 50.7; bearish continuation expected if RSI goes below 29.5.
This analysis is suitable for traders seeking a blend of price action, demand zone strategy, and momentum confirmation using Fibonacci and RSI.
Disclaimer
The information and publications are not meant to be, and do not constitute, financial, investment, trading, or other types of advice or recommendations supplied or endorsed by TradingView. Read more in the Terms of Use.
Disclaimer
The information and publications are not meant to be, and do not constitute, financial, investment, trading, or other types of advice or recommendations supplied or endorsed by TradingView. Read more in the Terms of Use.