📈 Current Price & Trend
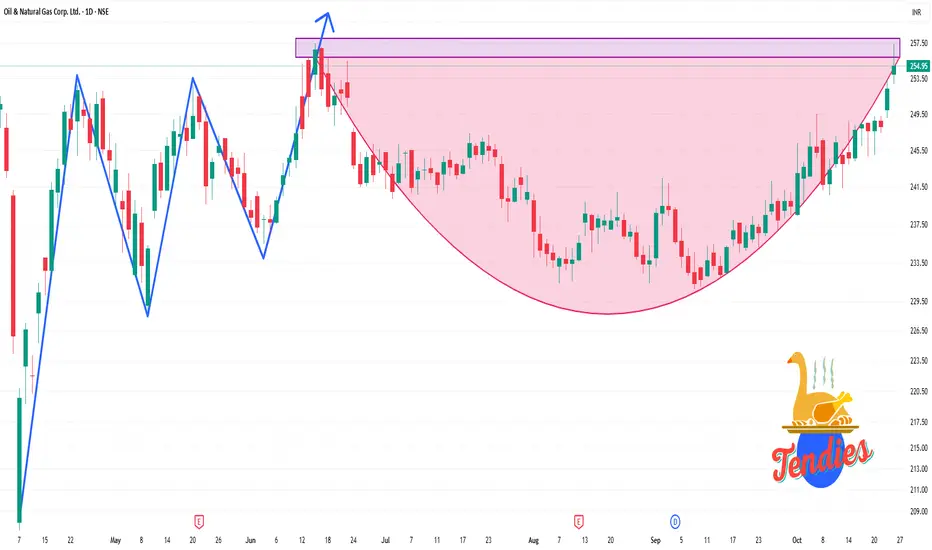
Current Price: ₹256.09
Day Range: ₹252.85 – ₹257.40
52-Week Range: ₹205.00 – ₹274.35
Market Cap: ₹3.21 trillion
P/E Ratio: 8.92
Dividend Yield: 4.80%
Beta: 1.05 (suggesting average market volatility)
🔍 Technical Indicators (Daily Time Frame)
RSI (14-day): 75.67 – Indicates the stock is in overbought territory, suggesting caution.
MACD: 2.23 – A bullish signal, indicating upward momentum.
Moving Averages:
5-day: ₹255.04 – Bullish
50-day: ₹248.31 – Bullish
200-day: ₹241.55 – Bullish
Related publications
Disclaimer
The information and publications are not meant to be, and do not constitute, financial, investment, trading, or other types of advice or recommendations supplied or endorsed by TradingView. Read more in the Terms of Use.
Related publications
Disclaimer
The information and publications are not meant to be, and do not constitute, financial, investment, trading, or other types of advice or recommendations supplied or endorsed by TradingView. Read more in the Terms of Use.