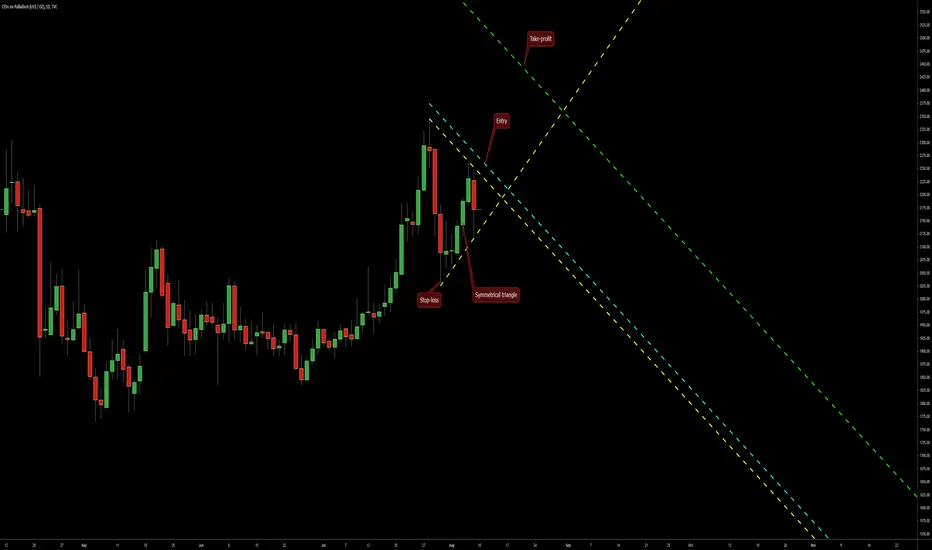
A symmetrical triangle formed on the daily chart of Palladium and now offers an opportunity to trade a bullish breakout setup. The triangle's borders are marked with the yellow lines. The potential entry level is shown with the cyan line. The potential take-profit level is where the green line is. Stop-loss can be set to the low of the triangle's base - at 2024.84.
Disclaimer
The information and publications are not meant to be, and do not constitute, financial, investment, trading, or other types of advice or recommendations supplied or endorsed by TradingView. Read more in the Terms of Use.
Disclaimer
The information and publications are not meant to be, and do not constitute, financial, investment, trading, or other types of advice or recommendations supplied or endorsed by TradingView. Read more in the Terms of Use.