### **Technical Analysis of Paytm (ONE 97 COMMUNICATIONS LTD - NSE)**
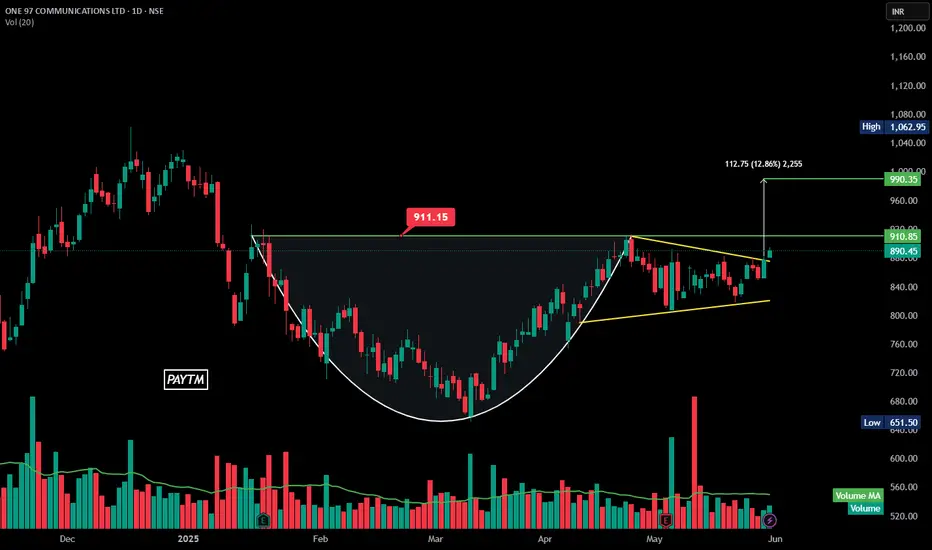
The chart highlights a **symmetrical triangle breakout**, signaling potential bullish momentum.
### **Key Observations:
**Symmetrical Triangle Formation:**
- The price oscillated between converging trendlines, forming a tightening range.
- The breakout above the upper trendline confirms bullish continuation.
**Cup and Handle Preceding the Breakout:**
- The earlier **cup and handle** pattern reinforced accumulation before the breakout.
**Breakout Confirmation:**
- **Resistance Level:** **911 INR**—a key level to watch.
- **Target Price:** **990.35 INR**, representing a **12.86% upside** from the breakout point.
**Volume Surge:**
- Increased trading activity during the breakout strengthens the validity of the move.
### **Indicators to Watch:**
- **RSI:58, it confirms strong buying momentum.
- **MACD:** A bullish crossover reinforces trend continuation.
- **Support Level:** **911 INR**—holding above this level strengthens the bullish case.
Disclaimer
The information and publications are not meant to be, and do not constitute, financial, investment, trading, or other types of advice or recommendations supplied or endorsed by TradingView. Read more in the Terms of Use.
Disclaimer
The information and publications are not meant to be, and do not constitute, financial, investment, trading, or other types of advice or recommendations supplied or endorsed by TradingView. Read more in the Terms of Use.