🔍 Technical Highlights
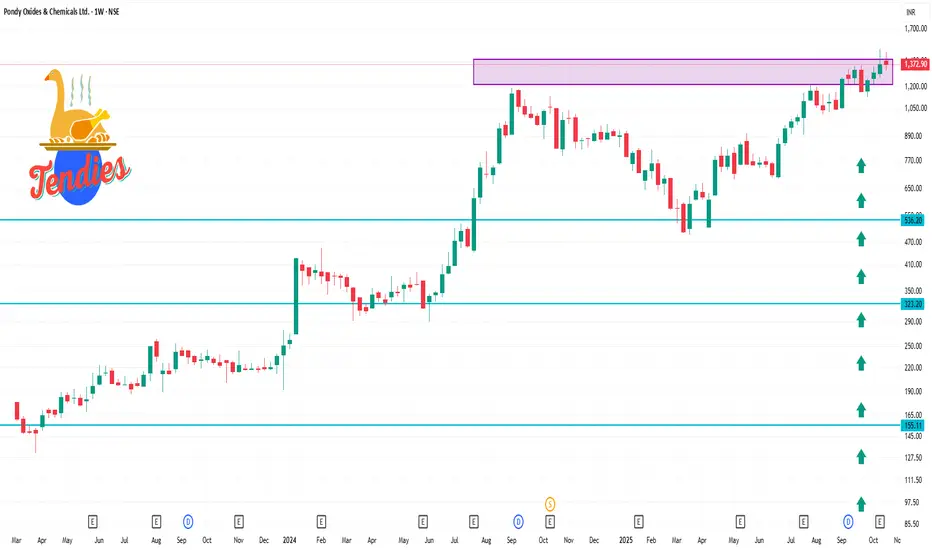
52-Week Range: ₹490.00 – ₹1,507.05
Current Price: ₹1,372.90
Beta: -0.68, indicating lower volatility compared to the market
Relative Strength Index (RSI): 59.08, suggesting the stock is neither overbought nor oversold
50-Day Moving Average: ₹1,222.79
200-Day Moving Average: ₹886.54
52-Week Range: ₹490.00 – ₹1,507.05
Current Price: ₹1,372.90
Beta: -0.68, indicating lower volatility compared to the market
Relative Strength Index (RSI): 59.08, suggesting the stock is neither overbought nor oversold
50-Day Moving Average: ₹1,222.79
200-Day Moving Average: ₹886.54
Related publications
Disclaimer
The information and publications are not meant to be, and do not constitute, financial, investment, trading, or other types of advice or recommendations supplied or endorsed by TradingView. Read more in the Terms of Use.
Related publications
Disclaimer
The information and publications are not meant to be, and do not constitute, financial, investment, trading, or other types of advice or recommendations supplied or endorsed by TradingView. Read more in the Terms of Use.