Hello Friends, Welcome to RK_Chaarts,
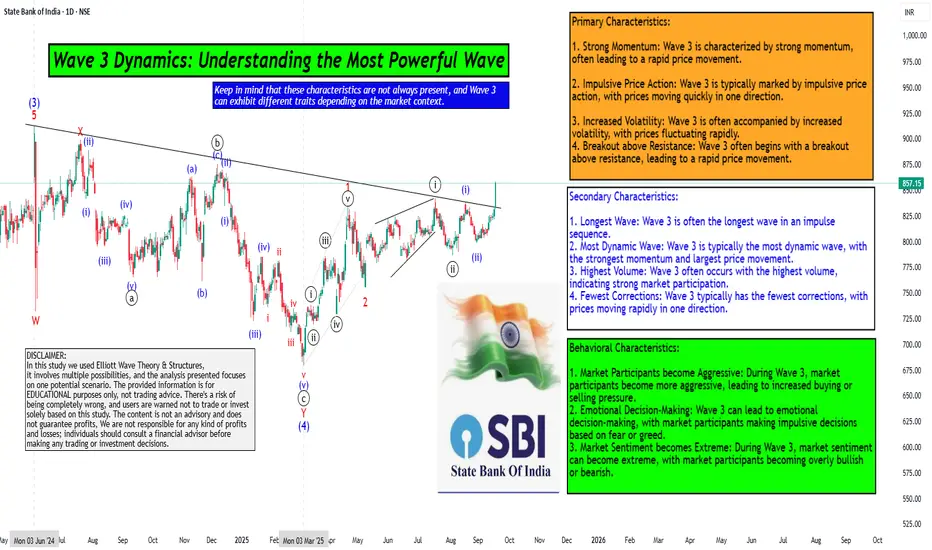
For Learning and Practicing chart Analyzing, Today we are trying to Analyse the State Bank of India (SBIN) chart from an Elliott Wave perspective, we can see that the intermediate-degree Wave (3) completed at the June 2024 high. This was followed by a complex correction that ended at the March 2025 low, marking the completion of Wave (4).
We are currently unfolding Wave (5), which will complete the higher-degree Wave ((3)) of Primary degree in black. Within Wave (5), we have five minor-degree subdivisions, which we can see unfolding.
The first minor-degree Wave 1 completed at the 22nd April 2025 high, followed by a Wave 2 correction that ended at the May 9, 2025 low. We are currently in Wave 3, which is a dynamic wave with strong momentum.
Within Wave 3, we have five minute-degree subdivisions, which are unfolding. The first two subdivisions are complete, and we are currently in the third subdivision.
The characteristics of Wave ((iii)) of 3 are evident in the price action, with a strong breakout above the resistance trend line and good intensity of volumes. The Moving Convergence Divergence (MACD) is also positive, and the Relative Strength Index (RSI) is above 60, indicating strong momentum.
The daily Exponential moving averages (50 and 200) are also aligned in favor of the trend. All these parameters support our view, and we can see an inverted head-and-shoulders pattern or a double rounding bottom pattern unfolding.
Overall, the breakout looks promising, and we can expect further upside in SBIN as per Elliott wave theory.
Detailed wave counts on chart

Primary Characteristics:
1. Strong Momentum: Wave 3 is characterized by strong momentum, often leading to a rapid price movement.
2. Impulsive Price Action: Wave 3 is typically marked by impulsive price action, with prices moving quickly in one direction.
3. Increased Volatility: Wave 3 is often accompanied by increased volatility, with prices fluctuating rapidly.
4. Breakout above Resistance: Wave 3 often begins with a breakout above resistance, leading to a rapid price movement.
Secondary Characteristics:
1. Longest Wave: Wave 3 is often the longest wave in an impulse sequence.
2. Most Dynamic Wave: Wave 3 is typically the most dynamic wave, with the strongest momentum and largest price movement.
3. Highest Volume: Wave 3 often occurs with the highest volume, indicating strong market participation.
4. Fewest Corrections: Wave 3 typically has the fewest corrections, with prices moving rapidly in one direction.
Behavioral Characteristics:
1. Market Participants become Aggressive: During Wave 3, market participants become more aggressive, leading to increased buying or selling pressure.
2. Emotional Decision-Making: Wave 3 can lead to emotional decision-making, with market participants making impulsive decisions based on fear or greed.
3. Market Sentiment becomes Extreme: During Wave 3, market sentiment can become extreme, with market participants becoming overly bullish or bearish.
Keep in mind that these characteristics are not always present, and Wave 3 can exhibit different traits depending on the market context.
Here are some snapshots shared below to understand the concept & example
Largest wave among wave 1-3-5
Strong Momentum like 90 degree move, Vertical move, Rapid move & Dynamic move

Breakout with good volumes
Price trading above 50, 100 & 200 Day Exponential Moving Average
RSI Breakout on Daily
RSI Breakout on Weekly
MACD weekly
MACD Daily
Pattern Repeating

I am not Sebi registered analyst. My studies are for educational purpose only.
Please Consult your financial advisor before trading or investing.
I am not responsible for any kinds of your profits and your losses.
Most investors treat trading as a hobby because they have a full-time job doing something else.
However, If you treat trading like a business, it will pay you like a business.
If you treat like a hobby, hobbies don't pay, they cost you...!
Hope this post is helpful to community
Thanks
RK💕
Disclaimer and Risk Warning.
The analysis and discussion provided on in.tradingview.com/u/RK_Chaarts/ is intended for educational purposes only and should not be relied upon for trading decisions. RK_Chaarts is not an investment adviser and the information provided here should not be taken as professional investment advice. Before buying or selling any investments, securities, or precious metals, it is recommended that you conduct your own due diligence. RK_Chaarts does not share in your profits and will not take responsibility for any losses you may incur. So Please Consult your financial advisor before trading or investing.
For Learning and Practicing chart Analyzing, Today we are trying to Analyse the State Bank of India (SBIN) chart from an Elliott Wave perspective, we can see that the intermediate-degree Wave (3) completed at the June 2024 high. This was followed by a complex correction that ended at the March 2025 low, marking the completion of Wave (4).
We are currently unfolding Wave (5), which will complete the higher-degree Wave ((3)) of Primary degree in black. Within Wave (5), we have five minor-degree subdivisions, which we can see unfolding.
The first minor-degree Wave 1 completed at the 22nd April 2025 high, followed by a Wave 2 correction that ended at the May 9, 2025 low. We are currently in Wave 3, which is a dynamic wave with strong momentum.
Within Wave 3, we have five minute-degree subdivisions, which are unfolding. The first two subdivisions are complete, and we are currently in the third subdivision.
The characteristics of Wave ((iii)) of 3 are evident in the price action, with a strong breakout above the resistance trend line and good intensity of volumes. The Moving Convergence Divergence (MACD) is also positive, and the Relative Strength Index (RSI) is above 60, indicating strong momentum.
The daily Exponential moving averages (50 and 200) are also aligned in favor of the trend. All these parameters support our view, and we can see an inverted head-and-shoulders pattern or a double rounding bottom pattern unfolding.
Overall, the breakout looks promising, and we can expect further upside in SBIN as per Elliott wave theory.
Detailed wave counts on chart
Primary Characteristics:
1. Strong Momentum: Wave 3 is characterized by strong momentum, often leading to a rapid price movement.
2. Impulsive Price Action: Wave 3 is typically marked by impulsive price action, with prices moving quickly in one direction.
3. Increased Volatility: Wave 3 is often accompanied by increased volatility, with prices fluctuating rapidly.
4. Breakout above Resistance: Wave 3 often begins with a breakout above resistance, leading to a rapid price movement.
Secondary Characteristics:
1. Longest Wave: Wave 3 is often the longest wave in an impulse sequence.
2. Most Dynamic Wave: Wave 3 is typically the most dynamic wave, with the strongest momentum and largest price movement.
3. Highest Volume: Wave 3 often occurs with the highest volume, indicating strong market participation.
4. Fewest Corrections: Wave 3 typically has the fewest corrections, with prices moving rapidly in one direction.
Behavioral Characteristics:
1. Market Participants become Aggressive: During Wave 3, market participants become more aggressive, leading to increased buying or selling pressure.
2. Emotional Decision-Making: Wave 3 can lead to emotional decision-making, with market participants making impulsive decisions based on fear or greed.
3. Market Sentiment becomes Extreme: During Wave 3, market sentiment can become extreme, with market participants becoming overly bullish or bearish.
Keep in mind that these characteristics are not always present, and Wave 3 can exhibit different traits depending on the market context.
Here are some snapshots shared below to understand the concept & example
Largest wave among wave 1-3-5
Strong Momentum like 90 degree move, Vertical move, Rapid move & Dynamic move
Breakout with good volumes
Price trading above 50, 100 & 200 Day Exponential Moving Average
RSI Breakout on Daily
RSI Breakout on Weekly
MACD weekly
MACD Daily
Pattern Repeating
I am not Sebi registered analyst. My studies are for educational purpose only.
Please Consult your financial advisor before trading or investing.
I am not responsible for any kinds of your profits and your losses.
Most investors treat trading as a hobby because they have a full-time job doing something else.
However, If you treat trading like a business, it will pay you like a business.
If you treat like a hobby, hobbies don't pay, they cost you...!
Hope this post is helpful to community
Thanks
RK💕
Disclaimer and Risk Warning.
The analysis and discussion provided on in.tradingview.com/u/RK_Chaarts/ is intended for educational purposes only and should not be relied upon for trading decisions. RK_Chaarts is not an investment adviser and the information provided here should not be taken as professional investment advice. Before buying or selling any investments, securities, or precious metals, it is recommended that you conduct your own due diligence. RK_Chaarts does not share in your profits and will not take responsibility for any losses you may incur. So Please Consult your financial advisor before trading or investing.
YouTube: youtube.com/@rk_charts
Telegram : t.me/RK_Charts
Twitter : @charts_rk
Email : rkcharts@gmail. com
Disclaimer.
I am not sebi registered analyst.
My studies are for educational purpose only.
Telegram : t.me/RK_Charts
Twitter : @charts_rk
Email : rkcharts@gmail. com
Disclaimer.
I am not sebi registered analyst.
My studies are for educational purpose only.
Related publications
Disclaimer
The information and publications are not meant to be, and do not constitute, financial, investment, trading, or other types of advice or recommendations supplied or endorsed by TradingView. Read more in the Terms of Use.