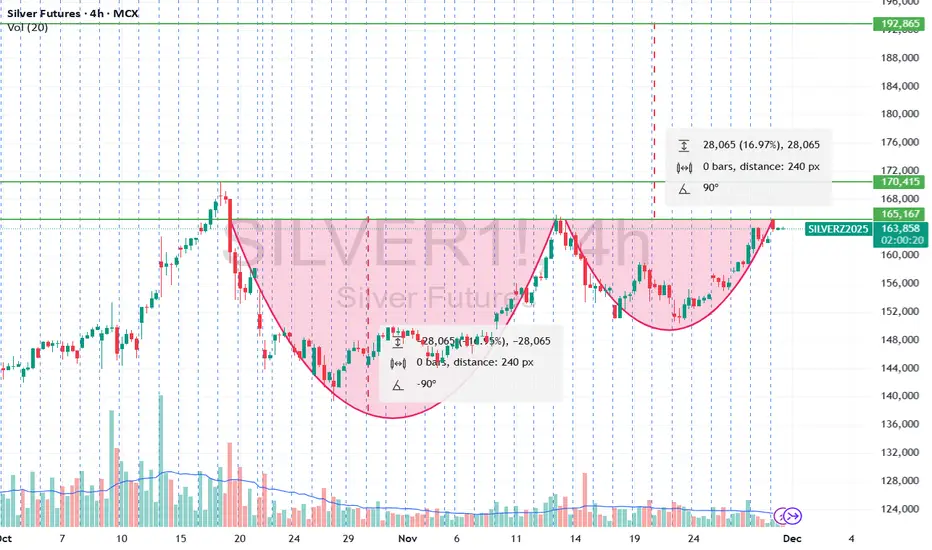
✅ 1. Pattern Type: Double Cup (Twin Cup) With Horizontal Neckline
Your chart shows:
✔️ Two large rounded bottoms
✔️ Both bottoms reach nearly the same support area
✔️ Upside rejections happen at nearly the same level
✔️ A single flat resistance line (neckline) at ~165,100 – 170,400 zone
This is a very bullish basing structure.
✅ 2. Why this pattern is powerful
A single cup & handle is already a bullish pattern.
But you have two consecutive cups, meaning:
🔥 Strong accumulation
🔥 Repeated buying interest at lower levels
🔥 Sellers getting weaker on each test
🔥 Smart money accumulation phase
This is NOT random — it shows institutions loading positions over weeks.
✅ 3. Understanding the Structure
⭕ First Cup
Sharp fall
Long rounded bottom
Gradual rise to neckline
Heavy accumulation region
⭕ Second Cup
Pullback
Higher low compared with first cup → bullish sign
Final rally toward neckline
Volume starts increasing → breakout pressure building
✔ Neckline (Major Resistance): ~165,000–170,400
This is the critical breakout level.
Price tested the neckline three times.
Every time sellers pushed it down — but with reduced strength.
This often indicates:
➡ Buyers are absorbing all sell orders
➡ Breakout is only a matter of time
✅ 4. Target Projection (Breakout Target)
You have already plotted the measurement correctly:
Cup Depth = ~28,065 points (16.97%)
Classic Cup & Handle breakout rule:
📌 Breakout Target = Neckline + Cup Depth
If breakout occurs above ~170,400, then:
🎯 Target = 170,400 + 28,065 = ~198,500
Your chart shows similar levels (192,865 is conservative target).
198k is extended target.
✅ 5. What must happen next? (Breakout Conditions)
✔ Strong candle close above neckline (no wick rejection)
✔ Volume spike confirming buyer dominance
✔ Retest of neckline as support (optional but ideal)
✔ Follow-through higher highs
If breakout is real, Silver can trend strongly for weeks.
✅ 6. Failure Conditions (Invalidation)
Pattern fails if:
❌ Price closes below second cup bottom
(around 147,000 – 150,000 area)
That would indicate breakdown from accumulation → turning into distribution.
But right now, price is bullish.
✅ 7. Market Psychology Behind the Pattern
This pattern tells a story:
1️⃣ First Cup = Panic selling → slow accumulation
2️⃣ Resistance rejection = Profit booking
3️⃣ Second Cup = Higher low → buyers stronger
4️⃣ Repeated top rejections = sellers weakening
5️⃣ Breakout = Markup phase begins
This is how smart money loads positions quietly and then drives the breakout.
✅ 8. Trading Strategy
🔥 Aggressive Entry
Enter on breakout strong candle above 170,400.
🔥 Conservative Entry
Wait for retest of neckline:
Price breaks above
Comes back to test support
Holds
Then go long
Stop Loss
Below second-cup mid-point (~158,000–160,000 region).
Targets
T1: 178,000
T2: 185,000
T3: 192,865 (your marked target)
Extended: 198,500
Disclaimer
The information and publications are not meant to be, and do not constitute, financial, investment, trading, or other types of advice or recommendations supplied or endorsed by TradingView. Read more in the Terms of Use.
Disclaimer
The information and publications are not meant to be, and do not constitute, financial, investment, trading, or other types of advice or recommendations supplied or endorsed by TradingView. Read more in the Terms of Use.