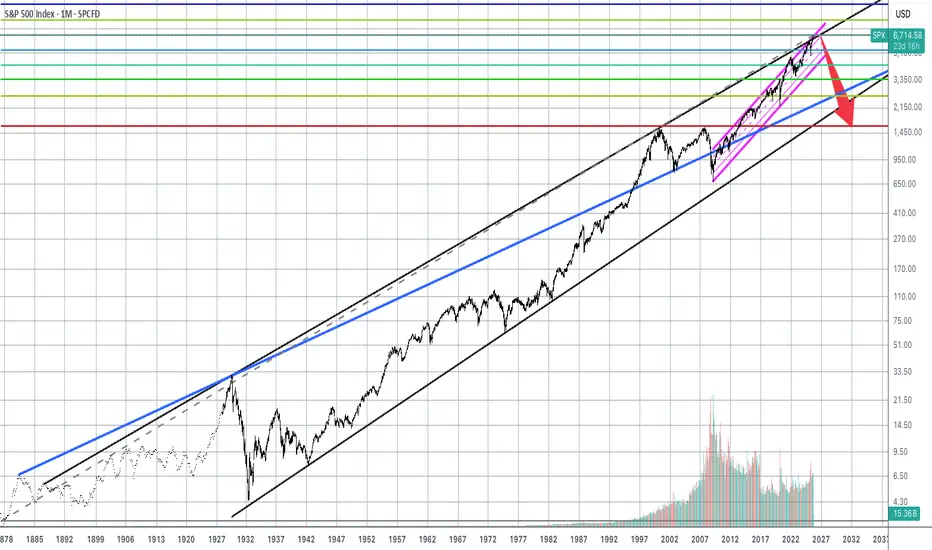
I decided to a big picture perspective SPX as it can sometimes be the clearest and most simple view. Not often do I come across a more valid (looking) setup. As you can see, this chart involves a whopping 140 year up-trending channel with a smaller pink channel within close to the upper bound. Both of which, current price action has just stepped above on the monthly chart. I believe this to be a blow off top that will be short lived. I'm not saying it can't spike a little higher or go sideways for a bit but this seems to be hitting hard resistance. It appears that it might be soon time to consider a short position for a protracted bear market. I know it seems impossible but technically price should, at some point, cross the lower black line. When we overlay fib retracements starting from the 1932 swing low to historical high, .236 lands right at the major support level just below 1600. Yes 1600. This is the first fib line and major support below the lower trend line. And when you examine the other retracement lines they all line up with significant support/resistance levels. I see this as confirmation of the entire bearish scenario to come. I think we are looking at a bumpy ride ahead if not a crash. I drew the blue trend line in as well, since it seems notable, and will be taking it into consideration also on the way down. Unfortunately you don't get a hundred year uptrend without some serious chart damage eventually. With valuations in nosebleed territory and the current geopolitical carnival in process, not to mention the numbers games being played in the financial data realm, would anyone be surprised if a big black swan came swooping in?!
Disclaimer
The information and publications are not meant to be, and do not constitute, financial, investment, trading, or other types of advice or recommendations supplied or endorsed by TradingView. Read more in the Terms of Use.
Disclaimer
The information and publications are not meant to be, and do not constitute, financial, investment, trading, or other types of advice or recommendations supplied or endorsed by TradingView. Read more in the Terms of Use.