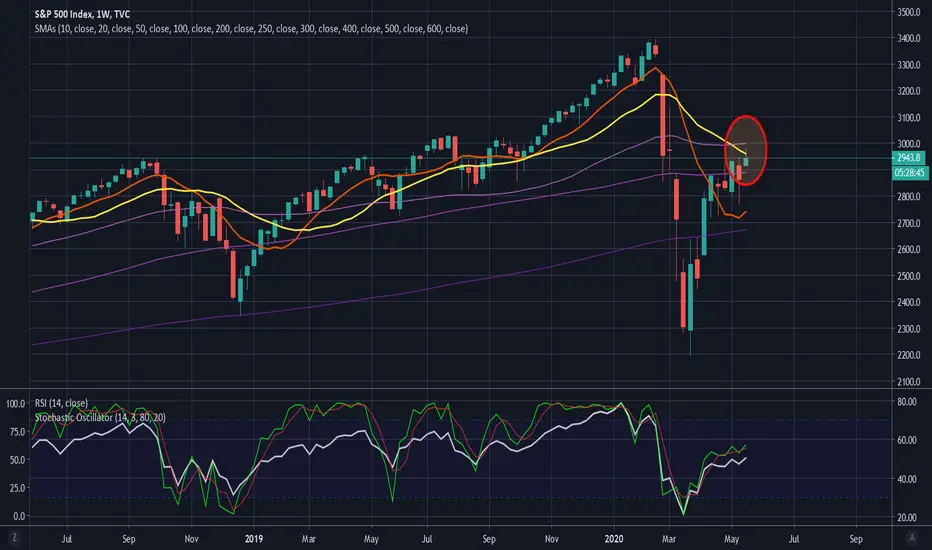
Watch this S&P 500 chart, and daily, for a broader perspective of whether stocks may start heading lower in the next week or two or continue rising. You can also check daily or 60min RSI and candle patterns.
Disclaimer
The information and publications are not meant to be, and do not constitute, financial, investment, trading, or other types of advice or recommendations supplied or endorsed by TradingView. Read more in the Terms of Use.
Disclaimer
The information and publications are not meant to be, and do not constitute, financial, investment, trading, or other types of advice or recommendations supplied or endorsed by TradingView. Read more in the Terms of Use.