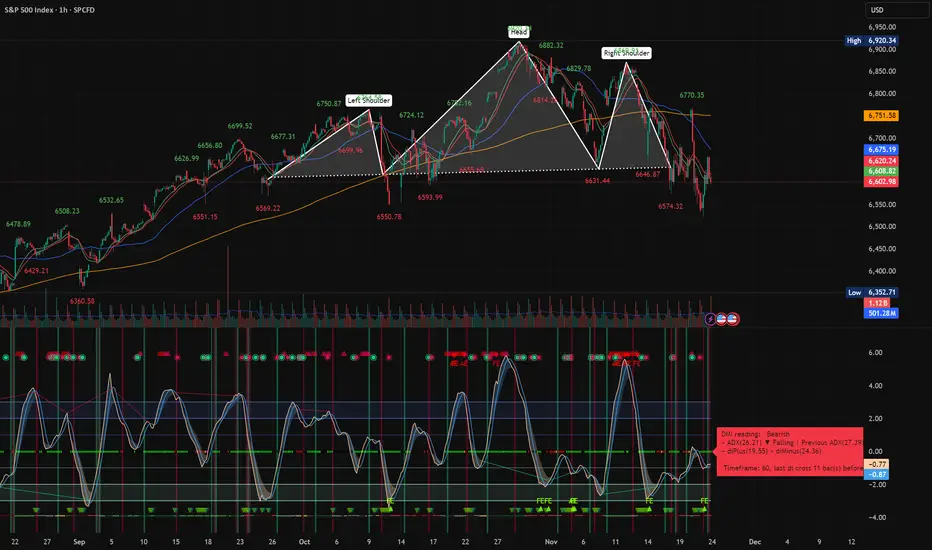
At the core of the current setup is a fully formed Head and Shoulders pattern, which has already broken its neckline and is now in the process of playing out its measured-move target. The left shoulder formed around 6750, the head extended to roughly 6882, and the right shoulder peaked near 6829. The neckline, positioned around 6590–6630, was decisively broken. This is crucial because a neckline break with momentum and no immediate reclaim typically confirms that a bearish trend has begun. The measured downside projection, based on subtracting the pattern height from the neckline, lands near 6350, which is also a visible structural level on the chart—adding confluence to the target.
Trend structure reinforces this bearish posture. Price is trading below both the 50 EMA and the 200 EMA, creating a dual timeframe downtrend. The 50 EMA has curled downward, illustrating a clear loss in short-term strength, while the 200 EMA has acted as resistance rather than support—another hallmark of a shift in momentum. Attempts to rally back above the neckline have been weak and short-lived, showing that buyers lack control. Until price can reclaim the neckline and hold above it, the path of least resistance remains to the downside.
Volume behavior also strengthens the bearish case. Downward moves are accompanied by heavier volume, while bounce attempts show declining volume and little enthusiasm. Frequent cluster WVF signals—AE, FE, and other markers—concentrated before the breakdown. Clusters that appear before structural breaks often signal distribution. Since no capitulation spike has appeared yet, it is likely that the move is not finished. VIX is above 26, as well and curling upwards.
On the lower panel, the Momentum Oscillator is oversold, but importantly, it has not produced a strong upward reversal. Historically, similar deep dips with hesitation tend to precede an additional flush lower before the next meaningful bounce. Meanwhile, the DMI (Directional Movement Index) gives a clear bearish reading. The displayed values show ADX falling from a higher level and –DI outperforming +DI. A falling ADX during a bearish configuration suggests that although the trend is bearish, the strength of acceleration is cooling slightly—often a pause before continuation. The “last DI cross 11 bars ago” informs us that this downtrend is still young; past cycles in this chart tend to run significantly longer, suggesting more room for follow-through.
Altogether, the evidence points to a strong bearish bias. The breakdown from the Head and Shoulders pattern, rejection from both EMAs, confirming volume, bearish DMI, and lack of bullish divergence collectively support a continued decline toward the 6350 region. A rally could occur, but unless it recaptures the 50 EMA and the neckline, any bounce is likely to be corrective rather than trend-changing. For now, the most probable direction remains downward, with the measured move target representing a logical destination before any larger reversal attempt emerges.
Gabriel Amadeus
The Real World - Stocks Campus:
Stocks, Options, Futures, Forex, Crypto, this is what we trade.
Learn profitable trading systems or build your own, just like I did.
jointherealworld.com/?a=f7jkjpg8kh
The Real World - Stocks Campus:
Stocks, Options, Futures, Forex, Crypto, this is what we trade.
Learn profitable trading systems or build your own, just like I did.
jointherealworld.com/?a=f7jkjpg8kh
Related publications
Disclaimer
The information and publications are not meant to be, and do not constitute, financial, investment, trading, or other types of advice or recommendations supplied or endorsed by TradingView. Read more in the Terms of Use.