/ES (SP500 fut.) has dropped like a stone in the deep sea over night (currently at time of writing ~1,5%).
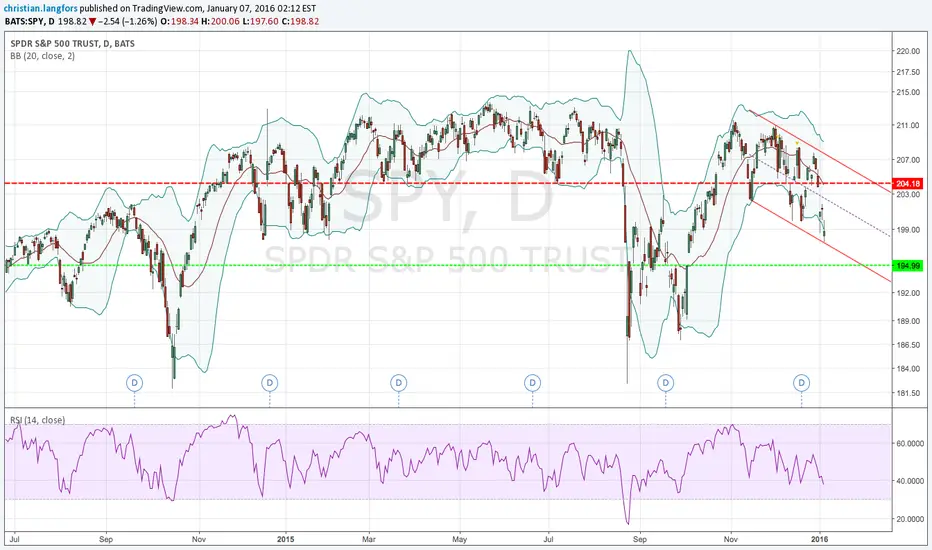
SPY closed already yesterday below lower Bollinger Bands on the daily chart and if the market opens & closes at another -1,5%, we are way below the lower Bollinger Bands.
By looking at the historical SPY charts, I'd say there is quite good odds for another blow off selling event, leading to a strong rebound. IF there will be such an event, it is obviously impossible to say from where it will/could rebound but personally I will look what happens when RSI(14) get lower to that 30-level.
Nothing in the price action in the SPY daily chart wants me to go long. ....and perhaps that is the best bullish sign there is ;-)
Related publications
Disclaimer
The information and publications are not meant to be, and do not constitute, financial, investment, trading, or other types of advice or recommendations supplied or endorsed by TradingView. Read more in the Terms of Use.
Related publications
Disclaimer
The information and publications are not meant to be, and do not constitute, financial, investment, trading, or other types of advice or recommendations supplied or endorsed by TradingView. Read more in the Terms of Use.