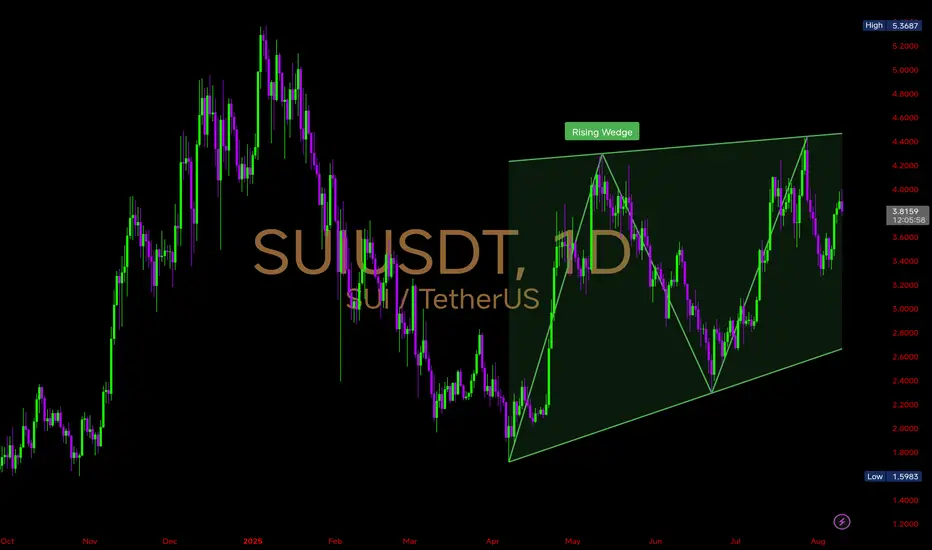
Price is currently trading inside a Rising Wedge pattern on the 1D timeframe — a structure that often signals potential trend exhaustion if broken to the downside, but can still extend higher within the channel before a breakout.
🔹Support: The lower wedge trendline has acted as a strong demand zone since April, with each test triggering a bounce.
🔸Resistance: The upper wedge trendline has repeatedly capped rallies near the $4.20–$4.40 zone.
🔹Current Price Action: #SUI Trading around $3.81, mid-range of the wedge, showing balanced buyer–seller pressure.
🔸Momentum: Higher lows are still intact, suggesting bullish structure until the lower wedge breaks.
POSSIBLE SCENARIOS
1️⃣ Bullish: Price pushes toward the $4.20–$4.40 resistance; a breakout above could target the $5+ zone.
2️⃣ Bearish: A breakdown below the lower wedge support (~$3.00) could trigger a deeper pullback toward $2.60–$2.40.
Watch for decisive daily candle closes near wedge boundaries — that will dictate the next major leg.
Disclaimer
The information and publications are not meant to be, and do not constitute, financial, investment, trading, or other types of advice or recommendations supplied or endorsed by TradingView. Read more in the Terms of Use.
Disclaimer
The information and publications are not meant to be, and do not constitute, financial, investment, trading, or other types of advice or recommendations supplied or endorsed by TradingView. Read more in the Terms of Use.