As of the latest available data, here are the key support and resistance levels for Tata Motors Ltd. (TATAMOTORS) for the upcoming week:
📊 Weekly Support and Resistance Levels
Type Level Value (₹)
Support S1 773.38
S2 756.47
S3 737.93
Resistance R1 808.83
R2 827.37
R3 844.28
These levels are derived from technical analysis and serve as potential entry, exit, or stop-loss points for traders. A breach below the support levels could indicate a bearish trend, while a breakout above the resistance levels may signal a bullish move.
🔍 Technical Indicators Overview
RSI (14): 43.38 — Indicates neutral momentum.
MACD (12,26): 0 — Suggests a neutral trend.
Moving Averages:
20-day SMA: 655.61 — Slightly below current price, indicating a potential short-term downtrend.
50-day SMA: 655.34 — Aligns with the 20-day SMA, reinforcing the neutral to bearish outlook.
200-day SMA: 655.93 — Further confirms the downtrend.
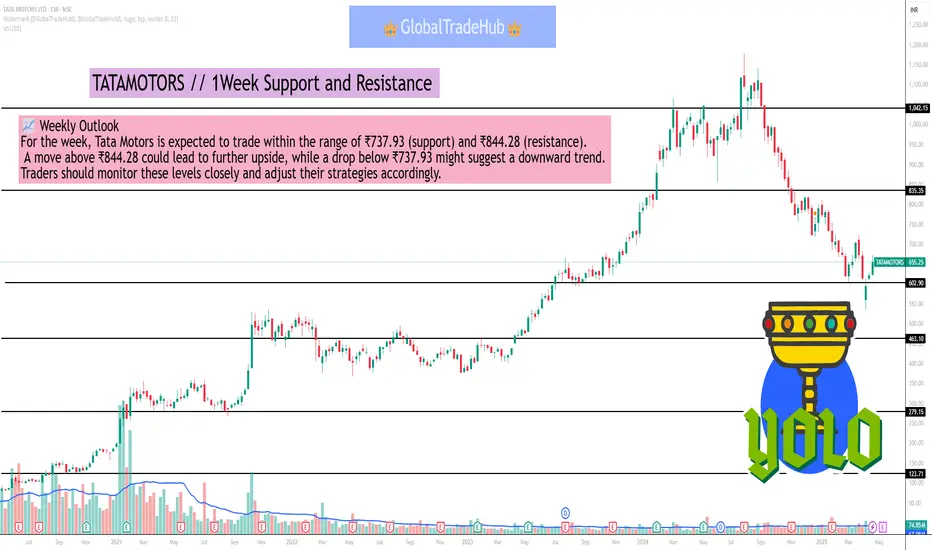
📈 Weekly Outlook
For the week, Tata Motors is expected to trade within the range of ₹737.93 (support) and ₹844.28 (resistance). A move above ₹844.28 could lead to further upside, while a drop below ₹737.93 might suggest a downward trend. Traders should monitor these levels closely and adjust their strategies accordingly.
📊 Weekly Support and Resistance Levels
Type Level Value (₹)
Support S1 773.38
S2 756.47
S3 737.93
Resistance R1 808.83
R2 827.37
R3 844.28
These levels are derived from technical analysis and serve as potential entry, exit, or stop-loss points for traders. A breach below the support levels could indicate a bearish trend, while a breakout above the resistance levels may signal a bullish move.
🔍 Technical Indicators Overview
RSI (14): 43.38 — Indicates neutral momentum.
MACD (12,26): 0 — Suggests a neutral trend.
Moving Averages:
20-day SMA: 655.61 — Slightly below current price, indicating a potential short-term downtrend.
50-day SMA: 655.34 — Aligns with the 20-day SMA, reinforcing the neutral to bearish outlook.
200-day SMA: 655.93 — Further confirms the downtrend.
📈 Weekly Outlook
For the week, Tata Motors is expected to trade within the range of ₹737.93 (support) and ₹844.28 (resistance). A move above ₹844.28 could lead to further upside, while a drop below ₹737.93 might suggest a downward trend. Traders should monitor these levels closely and adjust their strategies accordingly.
Related publications
Disclaimer
The information and publications are not meant to be, and do not constitute, financial, investment, trading, or other types of advice or recommendations supplied or endorsed by TradingView. Read more in the Terms of Use.
Related publications
Disclaimer
The information and publications are not meant to be, and do not constitute, financial, investment, trading, or other types of advice or recommendations supplied or endorsed by TradingView. Read more in the Terms of Use.