📈 Daily Support & Resistance Levels
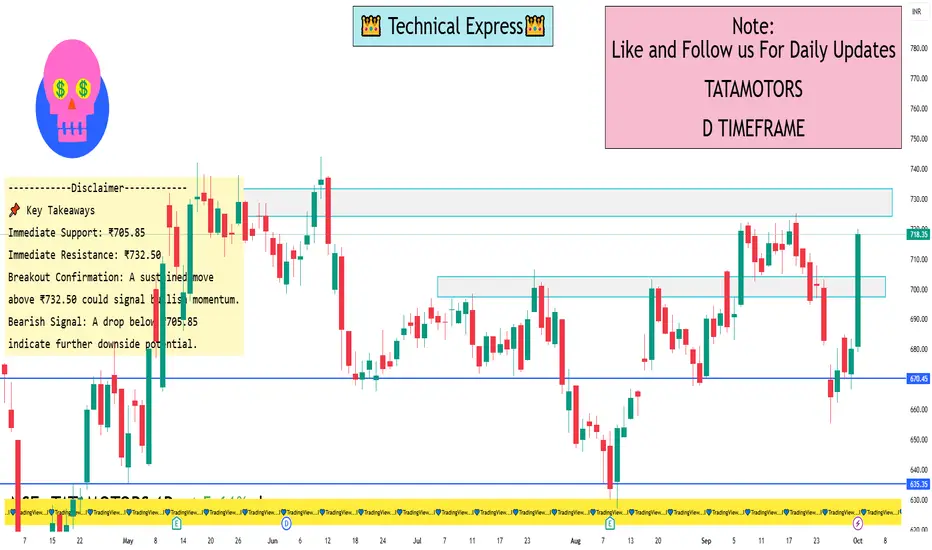
Immediate Support: ₹705.85
Immediate Resistance: ₹732.50
Pivot Point: ₹705.85
These levels are derived from the Classic Pivot Point analysis, indicating that the stock is trading near its pivot point, suggesting a neutral bias with potential for breakout or pullback depending on market momentum.
🔁 Fibonacci Retracement Levels
Key Support Levels:
23.6%: ₹694.85
38.2%: ₹664.45
50%: ₹639.88
61.8%: ₹615.30
Key Resistance Levels:
23.6%: ₹767.50
38.2%: ₹797.90
50%: ₹822.47
61.8%: ₹847.05
These Fibonacci levels provide potential support and resistance zones, useful for identifying entry and exit points.
📉 Technical Indicators
Relative Strength Index (RSI): Approximately 42.6, indicating early bullish momentum.
Moving Averages: The stock is trading below its 5-day and 13-day moving averages, suggesting a bearish trend.
🧭 Trend Analysis
The stock is currently trading near its pivot point, indicating a neutral bias. A breakout above ₹732.50 could signal bullish momentum, while a drop below ₹705.85 may indicate further downside potential.
📌 Key Takeaways
Immediate Support: ₹705.85
Immediate Resistance: ₹732.50
Breakout Confirmation: A sustained move above ₹732.50 could signal bullish momentum.
Bearish Signal: A drop below ₹705.85 may indicate further downside potential.
Immediate Support: ₹705.85
Immediate Resistance: ₹732.50
Pivot Point: ₹705.85
These levels are derived from the Classic Pivot Point analysis, indicating that the stock is trading near its pivot point, suggesting a neutral bias with potential for breakout or pullback depending on market momentum.
🔁 Fibonacci Retracement Levels
Key Support Levels:
23.6%: ₹694.85
38.2%: ₹664.45
50%: ₹639.88
61.8%: ₹615.30
Key Resistance Levels:
23.6%: ₹767.50
38.2%: ₹797.90
50%: ₹822.47
61.8%: ₹847.05
These Fibonacci levels provide potential support and resistance zones, useful for identifying entry and exit points.
📉 Technical Indicators
Relative Strength Index (RSI): Approximately 42.6, indicating early bullish momentum.
Moving Averages: The stock is trading below its 5-day and 13-day moving averages, suggesting a bearish trend.
🧭 Trend Analysis
The stock is currently trading near its pivot point, indicating a neutral bias. A breakout above ₹732.50 could signal bullish momentum, while a drop below ₹705.85 may indicate further downside potential.
📌 Key Takeaways
Immediate Support: ₹705.85
Immediate Resistance: ₹732.50
Breakout Confirmation: A sustained move above ₹732.50 could signal bullish momentum.
Bearish Signal: A drop below ₹705.85 may indicate further downside potential.
I built a Buy & Sell Signal Indicator with 85% accuracy.
📈 Get access via DM or
WhatsApp: wa.link/d997q0
Contact - +91 76782 40962
| Email: techncialexpress@gmail.com
| Script Coder | Trader | Investor | From India
📈 Get access via DM or
WhatsApp: wa.link/d997q0
Contact - +91 76782 40962
| Email: techncialexpress@gmail.com
| Script Coder | Trader | Investor | From India
Related publications
Disclaimer
The information and publications are not meant to be, and do not constitute, financial, investment, trading, or other types of advice or recommendations supplied or endorsed by TradingView. Read more in the Terms of Use.