📉 1-Week Price Movement
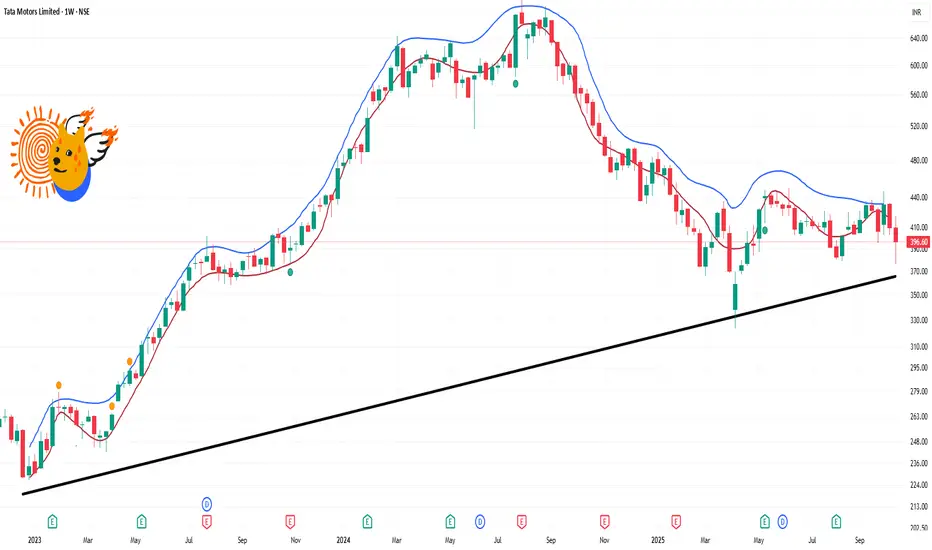
Current Price: ₹396.60
52-Week Range: ₹321.45 – ₹550.62
Recent Performance: The stock has experienced a significant decline of approximately 41.77% over the past week, largely due to the demerger of its commercial vehicle business.
📊 Technical Indicators (Weekly Overview)
Moving Averages: The stock is trading below key moving averages, indicating a bearish trend.
Relative Strength Index (RSI): The RSI is below 30, suggesting the stock is in oversold territory.
MACD: The MACD line is below the signal line, confirming a bearish momentum.
Stochastic Oscillator: The stochastic indicator is in the oversold zone, which may imply a potential reversal if buying interest returns.
Related publications
Disclaimer
The information and publications are not meant to be, and do not constitute, financial, investment, trading, or other types of advice or recommendations supplied or endorsed by TradingView. Read more in the Terms of Use.
Related publications
Disclaimer
The information and publications are not meant to be, and do not constitute, financial, investment, trading, or other types of advice or recommendations supplied or endorsed by TradingView. Read more in the Terms of Use.