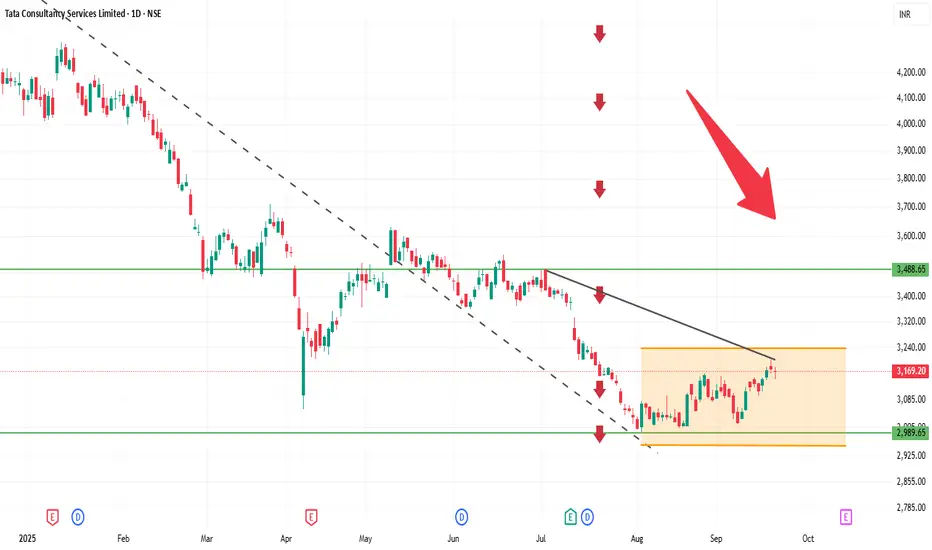
Current Price: Around 3,174
Current Trend: Stock is in a sideways to slightly bullish phase after consolidation.
Support Zone: Strong support at 3,140 – 3,150. Buyers may defend this level.
Resistance Zone: Key resistance at 3,200 – 3,220. A breakout above 3,220 can trigger fresh upside.
Indicators: Daily candles indicate mild buying interest; volume is stable.
Outlook:
Above 3,220 → bullish momentum may extend toward 3,250+.
Below 3,140 → weakness may push toward 3,100–3,120.
👉 In short:
Range: 3,140 – 3,220.
Neutral to slightly bullish; breakout will determine next move.
Related publications
Disclaimer
The information and publications are not meant to be, and do not constitute, financial, investment, trading, or other types of advice or recommendations supplied or endorsed by TradingView. Read more in the Terms of Use.
Related publications
Disclaimer
The information and publications are not meant to be, and do not constitute, financial, investment, trading, or other types of advice or recommendations supplied or endorsed by TradingView. Read more in the Terms of Use.