📊 Weekly Technical Overview
Current Price: ₹3,004.80 (NSE)
Weekly Performance: +3.57%
Year-to-Date Performance: −26.69%
52-Week High: ₹4,592.25 (Aug 30, 2024)
52-Week Low: ₹2,888.40
🔍 Key Technical Indicators
Moving Averages:
5-Day MA: ₹3,018.94 (Sell)
50-Day MA: ₹2,980.76 (Buy)
200-Day MA: ₹3,046.08 (Sell)
Relative Strength Index (RSI): Currently at 40, indicating a neutral stance.
MACD: Bearish crossover observed, suggesting downward momentum.
Support Levels: ₹2,888.40
Resistance Levels: ₹3,176.70
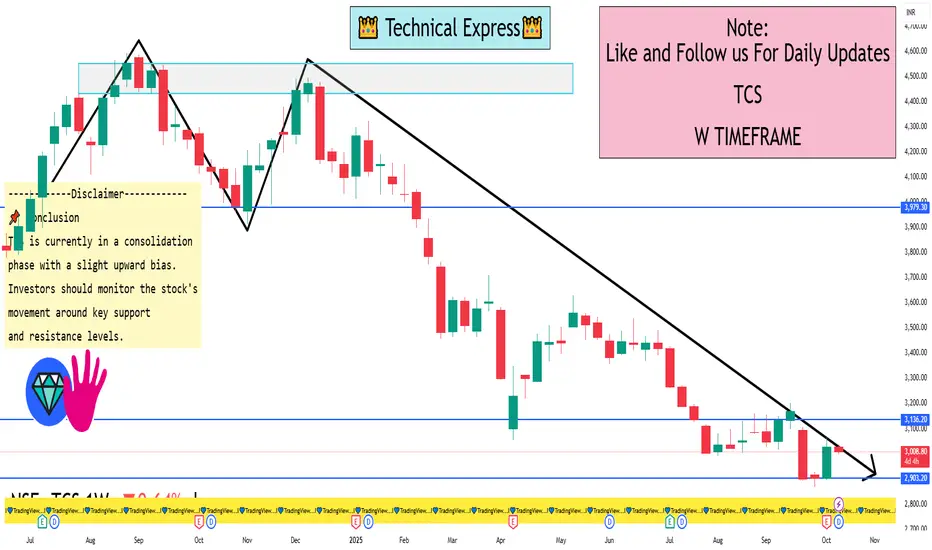
📌 Conclusion
TCS is currently in a consolidation phase with a slight upward bias. Investors should monitor the stock's movement around key support and resistance levels. A break below ₹2,888.40 could signal further downside, while a rise above ₹3,176.70 may indicate a potential trend reversal.
Current Price: ₹3,004.80 (NSE)
Weekly Performance: +3.57%
Year-to-Date Performance: −26.69%
52-Week High: ₹4,592.25 (Aug 30, 2024)
52-Week Low: ₹2,888.40
🔍 Key Technical Indicators
Moving Averages:
5-Day MA: ₹3,018.94 (Sell)
50-Day MA: ₹2,980.76 (Buy)
200-Day MA: ₹3,046.08 (Sell)
Relative Strength Index (RSI): Currently at 40, indicating a neutral stance.
MACD: Bearish crossover observed, suggesting downward momentum.
Support Levels: ₹2,888.40
Resistance Levels: ₹3,176.70
📌 Conclusion
TCS is currently in a consolidation phase with a slight upward bias. Investors should monitor the stock's movement around key support and resistance levels. A break below ₹2,888.40 could signal further downside, while a rise above ₹3,176.70 may indicate a potential trend reversal.
I built a Buy & Sell Signal Indicator with 85% accuracy.
📈 Get access via DM or
WhatsApp: wa.link/d997q0
Contact - +91 76782 40962
| Email: techncialexpress@gmail.com
| Script Coder | Trader | Investor | From India
📈 Get access via DM or
WhatsApp: wa.link/d997q0
Contact - +91 76782 40962
| Email: techncialexpress@gmail.com
| Script Coder | Trader | Investor | From India
Related publications
Disclaimer
The information and publications are not meant to be, and do not constitute, financial, investment, trading, or other types of advice or recommendations supplied or endorsed by TradingView. Read more in the Terms of Use.